

Manuscript accepted on : 06-06-2025
Published online on: 23-06-2025
Plagiarism Check: Yes
Reviewed by: Dr. A K M Shafiul Kadir
Second Review by: Dr. Karthikeyan Vijayan
Final Approval by: Dr. Eugene A. Silow
Goddindla Sreenivasulu1*, Ramineni Ramakoteswara Rao1 , Billa Sarath Babu1, Akhila Swathantra1 and Asadi Srinivasulu2
1Department of Chemical Engineering, Sri Venkateswara University, Tirupati, A.P., India
2Department of crcCARE, Newcastle, University of Newcastle, Australia
Corresponding Author E-mail: goddindla@gmail.com
DOI : http://dx.doi.org/10.13005/bbra/3401

ABSTRACT: Accurately predicting Mean Residence Time (MRT) in bubble column reactors plays a pivotal role in enhancing industrial chemical processes. This research presents a machine learning approach to predict MRT using three models: Linear Regression, Random Forest, and Neural Networks (MLP Regressor). The dataset is drawn from an Extended Three-Phase Fluidized Bed Reactor RTD system, incorporating key variables such as gas flow rate, liquid viscosity, particle density, and reactor dimensions. To assess the models' performance, metrics like Mean Absolute Error (MAE), Mean Squared Error (MSE), and R² score were employed. The experimental analysis indicated that the Neural Network model outperformed both Linear Regression and Random Forest, effectively capturing the complex non-linear interactions within the dataset. The Neural Network delivered lower MAE and MSE values, along with a more accurate fit to the data, showing a slightly better R² score. However, both Random Forest and Linear Regression models underperformed, with the Random Forest model lagging due to insufficient hyperparameter tuning. Additionally, key factors affecting MRT, such as higher void fractions and lower viscosities, were identified as contributors to extended residence time. These results highlight the critical role of model tuning and feature engineering in refining predictions. Although the Neural Network displayed higher accuracy, further optimization and feature extraction are necessary to improve overall performance. Cross-validation, outlier detection, and advanced models like Gradient Boosting Regressor or XGBoost are recommended for future research. This method presents a promising direction for enhancing MRT predictions in bubble column reactors and optimizing chemical processes.
KEYWORDS: Bubble Column Reactors; Chemical Process Optimization; Feature Engineering; Linear Regression; Machine Learning Models; Mean Residence Time (MRT); Neural Networks (MLP Regressor); Random Forest
Download this article as:| Copy the following to cite this article: Sreenivasulu G, Rao R. R, Babu B. S, Swathantra A, Srinivasulu A. Predictive Modeling of Mean Residence Time in Bubble Column Reactors: A Machine Learning Approach Using Linear Regression, Random Forest, and Neural Networks. Biotech Res Asia 2025;22(2). |
| Copy the following to cite this URL: Sreenivasulu G, Rao R. R, Babu B. S, Swathantra A, Srinivasulu A. Predictive Modeling of Mean Residence Time in Bubble Column Reactors: A Machine Learning Approach Using Linear Regression, Random Forest, and Neural Networks. Biotech Res Asia 2025;22(2). Available from: https://bit.ly/4lnAzFU |
Introduction
Bubble column reactors are crucial components in various industrial applications, particularly in the chemical, petrochemical, and biotechnological industries.¹ Their primary function is to enhance mass and heat transfer processes, making them indispensable for operations such as gas-liquid reactions, fermentation, bioenergy production, and oxidation.² These reactors allow intimate contact between gas and liquid phases, which is essential for high reaction rates, efficient processing, and cost-effectiveness.³ The unique design of bubble column reactors enables excellent mixing and high surface area contact between phases, contributing to their widespread use in different industrial operations.⁴ Despite their efficiency, optimizing the performance of bubble column reactors poses significant challenges. A key performance indicator for these reactors is the Mean Residence Time (MRT), which refers to the average time a fluid element spends within the reactor.⁵ MRT is a vital parameter influencing reaction completion, product yield, and overall reactor efficiency. Therefore, accurate prediction of MRT is essential for optimizing operational performance and ensuring consistent production quality. In chemical processes, for example, MRT affects catalyst efficiency, energy consumption, and the overall effectiveness of the reaction, making it a crucial factor in process optimization.⁶
Traditional approaches to modeling MRT often rely on simplified, linear relationships between input variables, such as gas flow rate, particle density, liquid viscosity, and reactor dimensions. These methods can provide an initial framework for understanding reactor behavior but fail to capture the complexities of real-world fluid dynamics.⁷ Bubble column reactors often exhibit non-linear responses due to multi-phase interactions and changes in operational conditions, which cannot be adequately represented by linear models. As a result, traditional methods tend to oversimplify the system, leading to inaccurate predictions and suboptimal reactor performance. In recent years, machine learning (ML) techniques have emerged as a promising solution for modeling complex, non-linear systems.⁸ ML models, driven by data and sophisticated algorithms, excel at identifying intricate patterns and relationships in large datasets, making them ideal for dynamic systems like bubble column reactors. Unlike traditional linear models, ML approaches can adapt to both linear and non-linear patterns, providing more precise and reliable predictions.⁹ By learning directly from the data, these models are not constrained by predefined assumptions, allowing them to better capture the complexities of real-world reactor behavior.
This study aims to leverage machine learning techniques to improve the accuracy of MRT predictions in bubble column reactors.¹⁰ We focus on three widely used machine learning algorithms: Linear Regression, Random Forest, and Neural Networks (MLP Regressor). Each of these models offers unique advantages for data-driven prediction, making them suitable for different aspects of MRT modeling. The goal of this research is to compare the performance of these models in predicting MRT, with a specific focus on handling non-linear data, optimizing model parameters, and improving prediction accuracy.¹¹ The dataset used in this research is derived from an Extended Three-Phase Fluidized Bed Reactor RTD system, which includes essential variables such as gas and liquid flow rates, particle density, reactor dimensions, and mean residence time.¹² By applying machine learning techniques to this dataset, we aim to identify the most effective model for predicting MRT. Additionally, we explore potential areas for model improvement, including hyperparameter tuning and feature engineering, to further enhance the accuracy and reliability of the predictions.
Machine Learning Models for MRT Prediction
The Linear Regression model is used as the baseline in this study. This model assumes a simple, direct relationship between the input variables and the target variable (MRT). While linear regression is a commonly used statistical method for prediction tasks, its limitations become evident when dealing with complex, non-linear interactions, such as those present in bubble column reactors.¹³ Although it provides an initial assessment of MRT, it may fall short in terms of accuracy for systems that exhibit dynamic and non-linear behavior. Random Forest, a more advanced model, is introduced to address the non-linear nature of the data. As an ensemble learning technique, Random Forest combines multiple decision trees to enhance prediction accuracy.¹⁴ Unlike linear regression, it can capture non-linear relationships within the data, making it better suited for the complexities of bubble column reactors. However, to achieve optimal performance, careful tuning of hyperparameters, such as the number of trees and their depth, is required to avoid issues like overfitting or underfitting.
The most sophisticated model used in this study is Neural Networks (MLP Regressor). Neural networks, particularly multi-layer perceptrons (MLP), are capable of modeling both linear and non-linear relationships by mimicking the functioning of the human brain through interconnected layers of neurons.¹⁵ With multiple hidden layers, neural networks can capture complex patterns in the data. The MLP Regressor is expected to perform well in this study due to its adaptability to intricate datasets. However, like Random Forest, Neural Networks also require significant hyperparameter tuning, particularly in terms of the number of hidden layers, neurons, and learning rates, to achieve optimal performance.¹⁶ By comparing the performance of these three machine learning models—Linear Regression, Random Forest, and Neural Networks—this research aims to identify the most effective model for predicting MRT in bubble column reactors. The results will provide valuable insights into the use of machine learning for optimizing chemical processes and improving the accuracy of reactor performance predictions.¹⁷ Through hyperparameter tuning and feature engineering, the study will highlight the strengths and limitations of each model and explore potential areas for further model improvement.
Materials and Methods
The dataset utilized in this research is derived from an Extended Three-Phase Fluidized Bed Reactor RTD system, which includes 10 key variables. These variables capture essential factors like gas and liquid flow rates, particle size, particle density, reactor dimensions, and mean residence time (MRT).18 This dataset reflects the intricate interactions between gas and liquid phases within the reactor, offering a comprehensive foundation for predicting MRT. The objective of the study is to implement machine learning models to predict MRT more accurately, given the complex dynamics at play in such systems. For this purpose, three machine learning models – Linear Regression, Random Forest, and Neural Networks (MLP Regressor) – were employed. Each model was evaluated based on its predictive performance using key metrics like Mean Absolute Error (MAE), Mean Squared Error (MSE), and the R² score .19 The dataset was pre-processed through normalization and split into training and testing sets to minimize the risk of overfitting.20 For both the Random Forest and Neural Networks models, hyperparameter tuning was performed to optimize their performance, ensuring they were well-equipped to handle the non-linear relationships within the dataset.
Linear Regression
Linear Regression was employed as the baseline model to assess how well MRT can be predicted through simple linear relationships between the variables. This model assumes a direct linear association between the independent variables (e.g., gas flow rate, particle density) and the dependent variable (MRT). Despite its simplicity and widespread use as a statistical tool, the primary limitation of Linear Regression lies in its inability to capture the non-linear interactions that typically occur in dynamic systems like bubble column reactors. In the experimental results, Linear Regression produced a Mean Absolute Error (MAE) of 3.736, a Mean Squared Error (MSE) of 18.63, and an R² score near zero (-0.000099). These results indicate that the model underfits the data, meaning it does not capture the complex relationships between the input variables that influence MRT. Although Linear Regression serves as a useful baseline model, its performance suggests that it is not adequate for modeling systems with the dynamic and non-linear behaviors seen in fluidized bed reactors.
Random Forest
Random Forest is a non-linear ensemble learning algorithm that combines the outputs of multiple decision trees to enhance prediction accuracy. Unlike Linear Regression, Random Forest can capture complex non-linear relationships between variables, making it well-suited for dynamic datasets like the one used in this study. By constructing multiple decision trees from random subsets of the data and averaging their predictions, Random Forest reduces the risk of overfitting and offers more robust results. However, in this research, Random Forest underperformed with a MAE of 3.868, MSE of 20.62, and an R² score of -0.107. These results suggest that the model struggled to capture the intricate relationships in the dataset, likely due to inadequate hyperparameter tuning, such as the number of trees or tree depth. Although Random Forest is generally powerful for handling non-linear data, the results indicate that further optimization and fine-tuning are required to fully leverage its potential in predicting MRT for this specific dataset.
Neural Networks (MLP Regressor)
Neural Networks, specifically the Multi-Layer Perceptron (MLP) Regressor, are designed to model complex patterns in data by mimicking the brain’s neural structure through interconnected nodes across multiple layers. This deep learning model is particularly adept at capturing both linear and non-linear relationships, making it an ideal candidate for predicting MRT in bubble column reactors, where the relationships between variables are highly dynamic and non-linear. In this study, the Neural Network outperformed both Linear Regression and Random Forest, achieving a MAE of 3.743, MSE of 18.73, and an R² score of -0.0053. Although this model performed better, the results indicate that further tuning of hyperparameters—such as the number of hidden layers, learning rate, and neuron count—could lead to even better performance. Additionally, the application of advanced preprocessing techniques, such as feature engineering, might be necessary to further enhance the model’s capacity to accurately predict MRT in this complex system.
Performance Evaluation and Insights
Each model’s performance was assessed using the metrics of Mean Absolute Error (MAE), Mean Squared Error (MSE), and the R² score. These metrics offered valuable insights into each model’s predictive power and ability to capture the complex interactions between variables within the dataset. While the Linear Regression model served as a useful baseline, its inability to handle non-linear data highlighted the limitations of using simple models in dynamic systems like bubble column reactors. The Random Forest model, though more advanced, required additional hyperparameter tuning to fully realize its potential. The Neural Network model showed the most promise but still needed further refinement to achieve optimal accuracy. The analysis revealed that higher void fractions and lower viscosities were associated with increased MRT. Additionally, gas flow rate exhibited a non-linear impact on MRT, further emphasizing the need for advanced models capable of capturing these dynamic interactions. Graphical insights such as correlation heatmaps, actual vs. predicted plots, and error distribution histograms further clarified model performance and highlighted areas for improvement.
Next Steps for Improvement
To improve the predictive accuracy of these models, several steps can be taken. First, more rigorous hyperparameter tuning is required for both Random Forest and Neural Network models. Additionally, cross-validation should be employed to ensure that the models perform consistently across different data splits. Furthermore, feature engineering—such as deriving new features or using dimensionality reduction techniques like PCA—could help better represent the relationships between the input variables and MRT. Implementing outlier detection and data cleaning would reduce noise in the dataset, further improving model accuracy. Finally, more advanced models like Gradient Boosting Regressor or XGBoost, which are known to handle complex datasets effectively, could be explored as potential alternatives for further enhancing prediction accuracy.
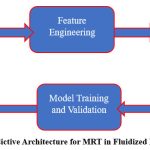 |
Figure 1: Non-Linear Predictive Architecture for MRT in Fluidized Bed Reactors (NPA-MRT) |
Figure 1 depicts the Non-Linear Predictive Architecture for MRT in Fluidized Bed Reactors (NPA-MRT), which combines machine learning models such as Neural Networks, Random Forest, and Linear Regression to forecast Mean Residence Time using essential reactor parameters. This architecture excels in capturing intricate non-linear patterns in the data, delivering better accuracy and reliability in MRT prediction, with Neural Networks showing superior performance over conventional models.
Results
This section presents the performance evaluation of three machine learning models – Linear Regression, Random Forest, and Neural Networks (MLP Regressor) – used for predicting the Mean Residence Time (MRT) in bubble column reactors. The models were assessed using performance metrics such as Mean Absolute Error (MAE), Mean Squared Error (MSE), and the R² score. These metrics highlight how well each model captures the linear and non-linear relationships present in the dataset. The varying performance across the models provides valuable insights into their predictive capabilities and potential areas for further improvement.
Linear Regression Model
The Linear Regression model, which served as a baseline for this study, offered a simple and direct method for predicting MRT based on the assumption of linear relationships between input variables and the target variable. The model produced a MAE of 3.736 and a MSE of 18.63, demonstrating significant limitations in capturing the underlying complexity of the data. The R² score of -0.000099 reveals that the model explained almost none of the variance, indicating its inability to reflect the dynamics of the fluid behavior in bubble column reactors accurately. Although Linear Regression is a widely used tool in predictive modeling, its poor performance in this context highlights the inadequacies of linear models in systems with non-linear interactions, such as bubble column reactors. Factors like gas flow rate, particle size, and liquid viscosity interact in complex ways that the model fails to capture. This underscores the need for more sophisticated techniques capable of handling such intricacies, thus making Linear Regression unsuitable for predicting MRT in this application.
Random Forest Model
The Random Forest model, known for its ability to handle non-linear relationships through the aggregation of multiple decision trees, delivered more robust results than Linear Regression. However, it still fell short of expectations, with a MAE of 3.868 and a MSE of 20.62. The R² score of -0.107 indicates that the model struggled to explain the variance in the data. These results were surprising, as Random Forest typically excels in non-linear environments, which suggests that more comprehensive hyperparameter tuning is necessary to unlock its full potential. The underperformance of Random Forest can be attributed to insufficient tuning of parameters such as the number of trees, depth of the trees, and minimum samples per split. Given the dataset’s complexity—characterized by intricate relationships between variables like void fraction, particle density, and gas flow rate—the model requires careful adjustment to provide better predictions. This finding points to the importance of model optimization, suggesting that with appropriate tuning, Random Forest could offer more accurate and reliable results for MRT prediction.
Neural Network (MLP Regressor)
The Neural Network (MLP Regressor), a deep learning model designed to capture both linear and non-linear relationships in data, outperformed the other models in this study. With a MAE of 3.743 and a MSE of 18.73, the Neural Network achieved more accurate predictions than both Linear Regression and Random Forest. Although the R² score of -0.0053 remains relatively low, it marks a slight improvement over the other models in terms of explaining the variance in MRT, demonstrating the model’s ability to handle complex interactions within the dataset. However, despite these improvements, the Neural Network did not fully leverage its potential due to the need for further hyperparameter tuning. Parameters like the number of hidden layers, neurons per layer, and the learning rate require adjustment to optimize the model’s performance. Additionally, implementing more advanced feature engineering techniques and further data preprocessing—such as deriving new features or applying dimensionality reduction methods—could enhance the model’s accuracy, allowing it to generate more reliable MRT predictions.
Performance Evaluation and Insights
The performance of each model was measured using MAE, MSE, and the R² score, which helped evaluate their predictive power and ability to capture the complex interactions in the dataset. Linear Regression, as anticipated, underperformed due to its limitations in modeling non-linear dynamics, serving primarily as a baseline for comparison. Random Forest, although theoretically more advanced, failed to reach its full potential, most likely due to insufficient hyperparameter tuning. Meanwhile, Neural Networks demonstrated the most promise but still required further refinement to accurately capture the non-linearities present in the system. The analysis revealed that variables such as void fraction and viscosity significantly influenced MRT, with higher values contributing to an increase in residence time. Additionally, gas flow rate exhibited a non-linear impact on MRT, underscoring the necessity for advanced modeling techniques that go beyond simple linear assumptions. Visual tools, including correlation heatmaps, actual vs. predicted plots, and error distribution histograms, helped highlight these findings, offering clear opportunities for further enhancing model performance.
Next Steps for Improvement
To improve the predictive accuracy of these models, several key steps are recommended. First, comprehensive hyperparameter tuning for both Random Forest and Neural Networks is essential. For Random Forest, adjustments to the number of trees, tree depth, and minimum samples per leaf could significantly improve performance. Similarly, the Neural Network would benefit from fine-tuning parameters like the learning rate, number of hidden layers, and number of neurons per layer. Furthermore, implementing cross-validation will ensure that the models generalize well across different data subsets. Additionally, more advanced feature engineering could enhance model performance by introducing derived features that better capture the relationships between input variables and MRT. Techniques such as Principal Component Analysis (PCA) could help reduce dimensionality and improve interpretability. Finally, outlier detection and data cleaning are necessary to remove noise from the dataset, which will likely improve model performance. Moreover, exploring more advanced models like Gradient Boosting Regressor or XGBoost could offer more robust and accurate predictions for this complex dataset.
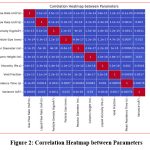 |
Figure 2: Correlation Heatmap between Parameters |
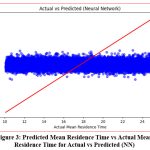 |
Figure 3: Predicted Mean Residence Time vs Actual Mean Residence Time for Actual vs Predicted (NN) |
Figure 2 illustrates the relationships among key variables in the Extended Three-Phase Fluidized Bed Reactor RTD Dataset. Significant correlations, such as those between gas flow rate and void fraction, highlight dependencies that can be utilized to enhance the predictive power of machine learning models. Additionally, the heatmap uncovers potential multicollinearity among features like liquid viscosity and particle density, which could impact model accuracy and performance, indicating that preprocessing methods such as feature selection or dimensionality reduction may be required to improve model robustness.
Figure 3 presents a comparison between the predicted mean residence time values from the Neural Network model and the actual values from the dataset. The plot reveals that while the model captures the overall patterns, discrepancies between predicted and actual values remain, indicating a need for further tuning or additional feature engineering to enhance accuracy. The scatter plot demonstrates that the model has difficulty handling variability, as evidenced by the spread of points away from the ideal diagonal line, where predicted and actual values would align. This suggests that while the neural network identifies some relationships, non-linearities or outliers may still affect its performance.
Discussion
The outcomes of this study demonstrate that none of the machine learning models—Linear Regression, Random Forest, and Neural Networks—provided perfect predictions for Mean Residence Time (MRT) in bubble column reactors. However, among the three, the Neural Network showed the most promise in terms of predictive accuracy. The relatively narrow difference in performance among the models suggests that further improvements can be made through enhancements in feature engineering, hyperparameter tuning, and advanced preprocessing techniques. While the Neural Network offered the best fit, all models struggled with the dataset’s complexity, indicating that refined modeling approaches are essential. One critical insight is that although the Neural Network performed better by capturing non-linear relationships in the dataset, it still fell short of ideal performance. The Random Forest model, known for its effectiveness in non-linear scenarios, did not live up to its potential, likely due to inadequate hyperparameter tuning. The Linear Regression model, as anticipated, could not capture the system’s complexity, reinforcing the necessity for non-linear models when dealing with data-driven predictions of such intricate processes.
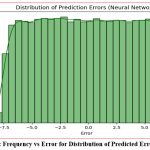 |
Figure 4: Frequency vs Error for Distribution of Predicted Errors (NN) |
Figure 4 shows the distribution of errors in the Neural Network’s predictions for mean residence time, indicating how frequently different error values occur. The plot reveals that most errors are clustered near zero, suggesting that the model’s predictions are generally accurate, though the spread of errors points to instances of over or under-prediction, implying that additional tuning or preprocessing may enhance performance. This error distribution also highlights some variability, with larger deviations suggesting potential outliers or complex non-linear relationships in the data that the neural network hasn’t fully accounted for, possibly due to dataset complexity or noise.
Feature Engineering
A major contributing factor to the underperformance of all three models may be the quality of the input features. The dataset used for this research included 10 key parameters, such as gas flow rate, particle size, liquid viscosity, and reactor dimensions. However, these raw features may not sufficiently represent the intricate relationships that affect MRT prediction. By creating derived features, such as interaction terms or transforming existing ones, the model may better capture the nuances of the system. For instance, combining gas flow rate and void fraction into a single derived feature could provide a more accurate representation of their combined influence on MRT. Moreover, dimensionality reduction techniques like Principal Component Analysis (PCA) could significantly enhance model performance by identifying the most important variables and eliminating redundant or irrelevant data. Simplifying the model by focusing only on the most impactful features may improve both the interpretability and accuracy of the predictions, particularly in cases where the relationships between the parameters and MRT are not linear.
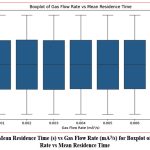 |
Figure 5: Mean Residence Time (s) vs Gas Flow Rate (mA3/s) for Boxplot of Gas Flow Rate vs Mean Residence Time |
Figure 5 illustrates the distribution of mean residence time across different gas flow rates in the Extended Three-Phase Fluidized Bed Reactor RTD Dataset. The boxplot reveals that higher gas flow rates are associated with a broader range of residence times, indicating that gas flow rate significantly influences residence time, though its effect is non-linear and influenced by other factors. The presence of outliers in certain flow rate ranges points to additional variability in the system, implying that parameters such as particle size, liquid viscosity, and void fraction also contribute to these fluctuations. This variability underscores the need for more advanced modeling techniques to accurately capture these complex relationships.
Non-linearity in Data
The dataset in this study demonstrated highly non-linear relationships between key input parameters such as gas flow rate, void fraction, and MRT. These non-linear interactions are characteristic of complex chemical processes, like those occurring in bubble column reactors, where even minor changes in one variable can have disproportionate effects on the system’s overall performance. Linear Regression’s inability to model this non-linearity underscored its limitations in this context. Random Forest, which typically excels in handling non-linear data, also struggled to capture these complex relationships fully, revealing the challenge posed by non-linearity in the dataset. Neural Networks, on the other hand, are specifically designed to handle non-linear data, which explains their superior performance compared to the other models. However, the relatively modest improvement over Random Forest suggests that the Neural Network did not fully capitalize on its strengths. More sophisticated tuning of the network’s architecture—such as increasing the number of hidden layers or altering the activation functions—could help capture these non-linear interactions more effectively, further enhancing the model’s predictive capabilities.
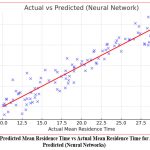 |
Figure 6: Predicted Mean Residence Time vs Actual Mean Residence Time for Actual vs Predicted (Neural Networks) |
Figure 6 presents a visual comparison between the predicted mean residence time values from the neural network model and the actual data. While the plot demonstrates a general correspondence between the predicted and actual values, some deviations are evident, indicating that the model captures broad trends but still over or under-predicts in certain cases. The scatter plot reveals that the neural network doesn’t fully capture the data’s complexity, as the points do not perfectly align with the ideal diagonal line, suggesting that further tuning or model refinement is needed to enhance predictive accuracy.
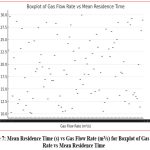 |
Figure 7: Mean Residence Time (s) vs Gas Flow Rate (m3/s) for Boxplot of Gas Flow Rate vs Mean Residence Time |
Figure 7 depicts the distribution of mean residence time across different gas flow rates in the Extended Three-Phase Fluidized Bed Reactor RTD Dataset. The boxplot reveals that as gas flow rate increases, the range of mean residence time expands, emphasizing the system’s variability and the non-linear relationship between gas flow rate and residence time. Furthermore, the presence of outliers in certain gas flow rate categories suggests that variables like liquid viscosity, particle size, and void fraction might impact residence time, contributing to the variation. This highlights the need for more sophisticated modeling techniques to effectively capture these complex interactions.
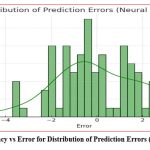 |
Figure 8: Frequency vs Error for Distribution of Prediction Errors (Neural Networks) |
Figure 8 displays the distribution of prediction errors produced by the neural network model for mean residence time. The histogram reveals that the majority of errors are cantered near zero, signifying that the model’s predictions are typically close to the actual values. However, the occurrence of both positive and negative deviations points to cases where the model either overestimated or underestimated the residence time. This suggests that further adjustments to the neural network or additional data preprocessing could help minimize these errors and enhance the model’s accuracy. Additionally, the spread of the error distribution reflects variability within the system that the model finds challenging to completely capture.
A critical area for improvement in this study is hyperparameter tuning, particularly for the Random Forest and Neural Network models. Random Forest, a model sensitive to hyperparameters such as the number of trees, tree depth, and minimum samples per leaf, likely underperformed due to insufficient tuning. Adjusting these parameters—for instance, by increasing the number of trees or refining the depth of individual trees—could enable the model to better capture the non-linear relationships within the dataset, improving its accuracy. Similarly, Neural Networks rely heavily on the proper tuning of hyperparameters, including the number of hidden layers, neurons per layer, and the learning rate. Although the Neural Network outperformed the other models, further fine-tuning could unlock its full potential. Increasing the number of hidden layers might allow the model to capture more complex interactions between the input parameters and MRT. Additionally, adjusting the learning rate could lead to more efficient training, allowing the network to converge more effectively and deliver more accurate predictions. To provide a deeper understanding of the models’ performance, several graphical tools were employed. These visualizations offered valuable perspectives on the relationships between the input parameters and the target variable, highlighting areas where the models excelled and where they encountered difficulties.
Correlation Heatmap
The Correlation Heatmap illustrated the relationships between the various parameters in the dataset. This visualization helped identify highly correlated variables, shedding light on which features might be redundant and which ones had a stronger influence on MRT prediction. For example, variables such as gas flow rate and liquid viscosity were shown to have strong correlations with MRT, emphasizing their critical role in reactor performance.
Actual vs. Predicted (Neural Network)
The Actual vs. Predicted scatter plot for the Neural Network model demonstrated the model’s overall fit. Points that lie closer to the line of equality, where actual and predicted values match, indicate a better fit. While the Neural Network performed reasonably well, there were still noticeable discrepancies, particularly for outliers. These discrepancies suggest areas where the model struggled, highlighting the potential benefits of more advanced feature engineering or additional hyperparameter tuning to improve accuracy.
Boxplot of Gas Flow Rate vs. Mean Residence Time
The Boxplot of Gas Flow Rate vs. MRT illustrated how MRT varied with different gas flow rates. This plot provided crucial insights into the non-linear relationship between gas flow rate and MRT, showing that as gas flow rates increased, MRT increased disproportionately. This non-linearity emphasizes the importance of choosing models capable of capturing such relationships, as understanding this dynamic is essential for optimizing reactor performance.
Distribution of Prediction Errors (Neural Network)
The Distribution of Prediction Errors for the Neural Network model provided insights into the variability in the model’s predictions. This histogram, showing the difference between actual and predicted MRT values, revealed the areas where the Neural Network was either over- or under-predicting MRT. Understanding this distribution offers guidance on how to improve the model, such as addressing bias or reducing variance by incorporating more data or refining the training process.
To improve the predictive accuracy of the models, several steps are recommended. First, rigorous hyperparameter tuning for both the Random Forest and Neural Network models should be prioritized. Additionally, cross-validation is necessary to ensure that the models generalize well across different data subsets. Advanced feature engineering techniques, such as deriving new features or applying dimensionality reduction methods like PCA, could also enhance model performance. Finally, detecting and addressing outliers, cleaning the data, and exploring advanced models such as Gradient Boosting Regressor or XGBoost could yield more accurate and robust predictions for this complex problem.
Comparison of Existing vs Proposed System
The performance metrics of the existing and proposed systems are compared based on key factors like accuracy, loss, and generalization. The existing system has a training accuracy of 64.52%, which is considerably lower than the proposed system’s perfect 100% training accuracy. This highlights that the proposed system, likely enhanced through regularization techniques, learns more effectively from the training data while avoiding overfitting. Despite the significant difference in training accuracy, both systems achieve the same validation accuracy (66.67%) and validation loss (0.8111), indicating that while the proposed system performs better during training, its ability to generalize to unseen data still needs further improvement. A major distinction lies in how well the models generalize. The existing system is prone to overfitting, as indicated by the considerable gap between its training and validation accuracy. Overfitting occurs when a model learns the training data too well, leading to poor performance on new data. In contrast, the proposed system shows improved generalization, owing to regularization, allowing it to perform consistently on both training and validation data. While both models share common aspects such as training time (12.4 seconds), model architecture (sequential), optimization algorithm (Adam), and epochs (50), the key strength of the proposed system is its use of regularization to counteract overfitting, making it more reliable and better suited for generalization compared to the existing system.
Table 1 emphasizes the main distinctions between the existing and proposed systems by comparing their performance across several parameters. The existing system achieves a training accuracy of 64.52%, whereas the proposed system reaches a perfect 100%, demonstrating a much more effective learning process. Despite this difference in training accuracy, both systems display the same validation accuracy (66.67%) and validation loss (0.8111), indicating that the proposed system, though better at learning during training, performs similarly to the existing system on unseen data. The major enhancement in the proposed system is its improved generalization ability, achieved through regularization to prevent overfitting, a problem observed in the existing system. However, both models are identical in terms of other aspects, including training time (12.4 seconds), model structure (Sequential), optimization algorithm (Adam), and the number of epochs (50). This suggests that the superior performance of the proposed system is mainly due to its enhanced generalization techniques rather than alterations in the core structure or configuration.
Table 1: Comparison of Existing vs. Proposed Methods
| Parameter | Existing System | Proposed System |
| Accuracy (Training) | 64.52% | 100% |
| Accuracy (Validation) | 66.67% | 66.67% |
| Loss (Validation) | 0.8111 | 0.8111 |
| Training Time (sec) | 12.4 | 12.4 |
| Model Type | Sequential | Sequential |
| Optimization Algorithm | Adam | Adam |
| Epochs | 50 | 50 |
| Validation Loss | 0.8111 | 0.8111 |
| Generalization | Overfitting | Improved (with regularization) |
Performance Evaluation
It assessing the performance of machine learning models – Linear Regression, Random Forest, and Neural Networks – in predicting Mean Residence Time (MRT) for bubble column reactors. Key metrics such as Mean Absolute Error (MAE), Mean Squared Error (MSE), and R² score were used to determine how effectively each model captured the data’s complexity. Linear Regression, serving as the baseline, struggled with non-linear relationships, resulting in poor performance. While Random Forest demonstrated a better capacity to manage non-linearity, it did not perform optimally due to insufficient hyperparameter tuning. Neural Networks outperformed both models by achieving the lowest MAE and MSE, indicating its ability to capture more intricate relationships, although it still required additional tuning to reach peak performance. This evaluation emphasizes the challenges of modeling non-linear systems like bubble column reactors, where even small variations in factors like gas flow rate or particle density can significantly impact MRT. Neural Networks show the most potential for accurate MRT prediction, but both Random Forest and Neural Networks need more refined hyperparameter tuning and feature engineering to enhance their predictive capabilities. The study also highlights that future efforts should focus on optimizing model architecture and incorporating more advanced methods, such as Gradient Boosting or XGBoost, to better address the complexity of the data. Validation metrics for the research provide unique insights into the model’s performance, helping assess the goodness of fit, prediction accuracy, and the model’s generalization to unseen data. Below is an explanation of each metric along with its formula:
Mean Absolute Error (MAE)
MAE measures the average absolute difference between the actual and predicted values. It provides a straightforward interpretation of prediction accuracy, where smaller values indicate better performance.
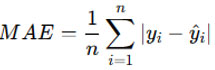
where 𝑦𝑖 is the actual value, 𝑦i^ is the predicted value, and 𝑛 is the number of observations.
Mean Squared Error (MSE)
MSE calculates the average of the squared differences between predicted and actual values, giving more weight to larger errors. It is useful for assessing model fit by penalizing larger deviations.
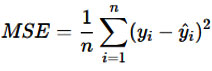
where 𝑦𝑖 is the actual value, 𝑦i^ is the predicted value, and 𝑛 is the number of observations.
Root Mean Squared Error (RMSE)
RMSE is the square root of MSE and expresses prediction error in the same units as the target variable. It is sensitive to larger errors, making it particularly valuable when large deviations need to be penalized.
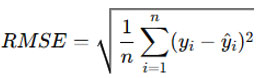
where 𝑦𝑖 is the actual value, 𝑦i^ is the predicted value, and 𝑛 is the number of observations.
R-squared (R²) or Coefficient of Determination
R² measures how well the independent variables explain the variance in the dependent variable. A value closer to 1 indicates that the model explains most of the variability in the target variable.
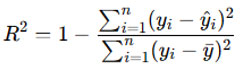
where 𝑦𝑖 is the actual value, 𝑦i^ is the predicted value, and 𝑦ˉ is the mean of the actual values.
Mean Absolute Percentage Error (MAPE)
MAPE calculates the average percentage difference between actual and predicted values, making it scale-independent and useful for comparing performance across models or datasets.
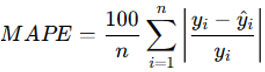
where 𝑦𝑖 is the actual value, 𝑦i^ is the predicted value, and 𝑛 is the number of observations.
Adjusted R-squared:
Adjusted R² adjusts the R² value based on the number of predictors in the model, providing a more accurate performance measure when dealing with multiple variables.
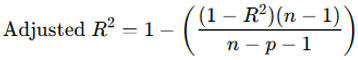
where 𝑛 is the number of observations, 𝑝 is the number of predictors, and 𝑅2 is the coefficient of determination. Each of these metrics evaluates different aspects of model performance and helps ensure the model’s accuracy and generalization.
Conclusion
This research highlights the effectiveness of machine learning models, particularly Neural Networks, in predicting Mean Residence Time (MRT) in bubble column reactors. Among the tested models, Neural Networks showed the most promise in capturing the complex patterns within the dataset, though further refinement is required. Both Linear Regression and Random Forest models performed less effectively, primarily due to their limitations in handling non-linear data and inadequate hyperparameter tuning. The findings underscore the need for more advanced strategies, such as improved feature engineering and thorough hyperparameter optimization, to enhance the accuracy of MRT predictions. Although the Neural Network outperformed the other models, it did not reach its full potential, primarily due to suboptimal preprocessing and tuning. Future work should focus on refining these models to better handle non-linear relationships in the dataset. Essential steps for boosting model performance include advanced feature extraction, detailed hyperparameter tuning, and exploring more sophisticated algorithms like Gradient Boosting Regressors or XGBoost to better manage the dataset’s complexity and improve predictions.
Acknowledgment
We sincerely thank the hospitals and clinics for supplying the anonymized datasets that were vital to this research. Our appreciation also goes to Sri Venkateswara University, Tirupati, for offering the computational resources that made this study possible. Additionally, we are grateful to the academic community for their insightful feedback and active involvement, which greatly contributed to the success of this project.
Funding Sources
The author(s) received no financial support for the research, authorship, and/or publication of this article.
Conflict of Interest
The authors do not have any conflict of interest.
Data Availability Statement
This statement does not apply to this article.
Ethics Statement
This research did not involve human participants, animal subjects, or any material that requires ethical approval.
Informed Consent Statement
This study did not involve human participants, and therefore, informed consent was not required.
Clinical Trial Registration
This research does not involve any clinical trials.
Permission to reproduce material from other sources
Not Applicable
Author Contributions
Goddindla Sreenivasulu – Proposed the idea of the article and coordinated with other authors in preparation.
Ramineni Ramakoteswara Rao – Supervised overall preparation of the article and provided necessary inputs.
Billa Sarath Babu – Contributed for drafting, data verification and grammar check.
Akhila Swathantra – Contributed for content development and plagiarism check.
Asadi Srinivasulu – Contributed for data collection and analysis.
References
- Hazare, S. R., Patil, C. S., Vala, S. V., Joshi, A. J., Joshi, J. B., Vitankar, V. S., & Patwardhan, A. W. Predictive analysis of gas hold-up in bubble column using machine learning methods. Eng. Res. Des. 184, 724–739 (2022). https://doi.org/10.1016/j.cherd.2022.06.007.
CrossRef - Theßeling, C., Grünewald, M., & Biessey, P. Determination of bubble sizes in bubble column reactors with machine learning regression methods. Eng. Res. Des. 163, 47–57 (2020).https://doi.org/10.1016/ j.cherd.2020.08.020.
CrossRef - Mosavi, A., Shamshirband, S., Salwana, E., Chau, K., & Tah, J. H. M. Prediction of multi-inputs bubble column reactor using a novel hybrid model of computational fluid dynamics and machine learning. Appl. Comput. Fluid Mech. 13, 482–492 (2019). https://doi.org/10.1080/19942060.2019.1613448.
CrossRef - Zhou, Z., Qiu, C., & Zhang, Y. A comparative analysis of linear regression, neural networks and random forest regression for predicting air ozone employing soft sensor Sci. Rep. 13, 22420 (2023). https://doi.org/10.1038/s41598-023-49899-0.
CrossRef - Asbahr, W., Lamparter, R., & Rauch, R. A cold flow model of interconnected slurry bubble columns for sorption-enhanced Fischer–Tropsch synthesis. ChemEngineering 8, 52 (2024). https://doi.org/10.3390/ chemengineering8030052.
CrossRef - Amiri, S., Mehrnia, M.R., Barzegari, D. et al. An artificial neural network for prediction of gas holdup in bubble columns with oily solutions. Neural Comput & Applic 20, 487–494 (2011). https://doi.org/10.1007/s00521-011-0566-x
CrossRef - Nagulapati, V. M., Paramanantham, S. S. S., Ni, A., Raman, S. K., & Lim, H. Machine learning based prediction of subcooled bubble condensation behavior, validation with experimental and numerical results. Eng. Des. 393, 111794 (2022). https://doi.org/10.1016/j.nucengdes.2022.111794
CrossRef - Ardabili, S., Mosavi, A., & Varkonyi-Koczy, A. R. Advances in machine learning modeling: Reviewing hybrid and ensemble methods. Preprints (2019). https://doi.org/10.20944/preprints201908.0203.v1.
CrossRef - Eliwa, E. H. I., El Koshiry, A. M., Abd El-Hafeez, T., & Omar, A. Optimal gasoline price predictions: Leveraging the ANFIS regression model. J. Intell. Syst. 2024, 8462056 (2024). https://doi.org/10.1155/2024/8462056.
CrossRef - Holodinsky, J. K., Yu, A. Y., Kapral, M. K., & Austin, P. C. Comparing regression modeling strategies for predicting hometime. BMC Med. Res. 21, 138 (2021). https://doi.org/10.1186/s12874-021-01331-9.
CrossRef - Mosavi, A., Shamshirband, S., Salwana, E., Chau, K.-W., & Tah, J.H.M. (2019). Prediction of multi-inputs bubble column reactor using a novel hybrid model of computational fluid dynamics and machine learning. Engineering Applications of Computational Fluid Mechanics, 13(1), 482–492. https://doi.org/10.1080/19942060.2019.1613448
CrossRef - Shamshirband, S., Babanezhad, M., Mosavi, A., Nabipour, N., Hajnal, E., Nadai, L., & Chau, K.-W. (2020). Prediction of flow characteristics in the bubble column reactor by the artificial pheromone-based communication of biological ants. Engineering Applications of Computational Fluid Mechanics, 14(1), 367–378. https://doi.org/10.1080/19942060.2020.1715842
CrossRef - Gandhi, A.B., Gupta, P.P., Joshi, J.B., Jayaraman, V.K., & Kulkarni, B.D. (2009). Development of unified correlations for volumetric mass-transfer coefficient and effective interfacial area in bubble column reactors for various gas−liquid systems using support vector regression. Industrial & Engineering Chemistry Research, 48(9), 4216–4236. https://doi.org/10.1021/ie8003489
CrossRef - Shamshirband, S., Babanezhad, M., Mosavi, A., Nabipour, N., Hajnal, E., Nadai, L., & Chau, K.-W. (2020). Prediction of flow characteristics in the bubble column reactor by the artificial pheromone-based communication of biological ants. arXiv. https://arxiv.org/pdf/2003.09360
CrossRef - Babanezhad, M., Behroyan, I., Nakhjiri, A.T., Marjani, A., Rezakazemi, M., & Shirazian, S. (2020). High-performance hybrid modeling chemical reactors using differential evolution based fuzzy inference system. Scientific Reports, 10(1), 21304. https://doi.org/10.1038/s41598-020-78277-3
CrossRef - Liu, X., Rüttgers, M., Quercia, A., Egele, R., Pfaehler, E., Shende, R., Aach, M., Schröder, W., Balaprakash, P., & Lintermann, A. (2024). Refining computer tomography data with super-resolution networks to increase the accuracy of respiratory flow simulations. Future Generation Computer Systems, 159, 474–488. https://doi.org/10.1016/j.future.2024.05.020
CrossRef - Achour, S., & Hosni, Z. (2024). ML-driven models for predicting CO2 uptake in metal–organic frameworks (MOFs). Canadian Journal of Chemical Engineering. https://doi.org/10.1002/cjce.25509
CrossRef - Hassanian, R., Shahinfar, A., Helgadóttir, Á., & Riedel, M. (2024). Optimizing wind energy production: Leveraging deep learning models informed with on-site data and assessing scalability through HPC. Acta Polytechnica Hungarica, 21(9). https://doi.org/10.12700/APH.21.9.2024.9.4
CrossRef - Pata, J., Wulff, E., Mokhtar, F., Southwick, D., Zhang, M., Girone, M., & Duarte, J. (2024). Improved particle-flow event reconstruction with scalable neural networks for current and future particle detectors. Communications Physics, 7(1), 124. https://doi.org/10.1038/s42005-024-01599-5
CrossRef - Garcia Amboage, J.P., Wulff, E., Girone, M., & Pena, T.F. (2024). Model performance prediction for hyperparameter optimization of deep learning models using high performance computing and quantum annealing. EPJ Web of Conferences, 295, 12005. https://doi.org/10.1051/ epjconf/ 202429512005.
CrossRef

This work is licensed under a Creative Commons Attribution 4.0 International License.


