

Manuscript accepted on : 29-09-2025
Published online on: 30-09-2025
Plagiarism Check: Yes
Reviewed by: Dr. Shahin Vahora
Second Review by: Dr. Sowjanya Kand Dr. Durgeshranjan Kar
Final Approval by: Dr. Eugene A. Silow
Swapnil Ghanshyam Dhake1* and Milind Kashinath Patel2
1Department of Engineering Sciences and Humanities, Sandip Institute of Technology and Research Centre, Nashik, Maharashtra, India
2Department of Chemistry, P.S.G.V.P.M’s S. I. P. Arts, G. B. P. Science and S.T.K.V.S Commerce College, Nandurbar, Maharashtra, India
Corresponding Author E-mail:swapnil.dhake554@gmail.com
ABSTRACT: Corchorus depressus (Linn.) is recognized for its diverse medicinal properties, including its efficacy in wound healing, antimicrobial activity, and cytotoxic effects on cancer cells. The current study sought to isolate and structurally characterize new compounds from two solvent extracts of Corchorus depressus (Linn.) leaves. Corchorus depressus (Linn.) dried leaves were extracted using cold maceration with methanol and ethanol. Column chromatography was used to separate four phytoconstituents: ME-1, ME-2, ETH-1, and ETH-2. The isolation and precise structural characterization of phytoconstituents from Corchorus depressus (Linn.) were accomplished through CHN analysis, IR, NMR, and mass spectral studies. The present work not only enriches the phytochemical profile of the plant but also opens avenues for evaluating the bioactive potential of its constituents.
KEYWORDS: Caffeic acid; Corchorus depressus (Linn.); Margaric acid; Pentacosylic acid; Stigmasterol
| Copy the following to cite this article: Dhake S. G, Patel M. K. Phytochemical Isolation and Structural Characterization of Compounds from Corchorus depressus (Linn.) leaves. Biotech Res Asia 2025;22(3). |
| Copy the following to cite this URL: Dhake S. G, Patel M. K. Phytochemical Isolation and Structural Characterization of Compounds from Corchorus depressus (Linn.) leaves. Biotech Res Asia 2025;22(3). Available from: https://bit.ly/471iclw |
Introduction
Indigenous medicinal systems have evolved over time, adapting to changes in plant availability and incorporation of new species. These systems are integral to many cultures, with local people relying heavily on wild plants for medicinal purposes, especially in areas less suitable for staple crop cultivation.1 Traditional medicine, also termed indigenous medicine, involves the accumulated wisdom, techniques, and methods that have emerged from a variety of cultural traditions, applied to sustain health and treat diseases.2 Notably, the use of traditional medicines varies globally. In developing nations, up to 80% of individuals rely on traditional medicine for their primary healthcare, whereas in industrialized countries, around half of the population opts for integrative medicine.3 The global herbal medicine market is projected to reach a value of $550 billion by 2030, with China and India emerging as the predominant exporters.4 These systems continue to play a significant role in global healthcare, offering potentially efficacious alternatives to conventional biomedicine, particularly for age-related, chronic, and infectious diseases.5
The medicinal significance of the Corchorus genus has been widely acknowledged in traditional Asian and African healing practices, where it has been used to address a range of health issues. This genus could be a valuable source of herbal remedies, playing a role in boosting health standards and ensuring livelihood security across Asia and Africa. The leaves of Corchorus species contain a diverse array of bioactive compounds, which confer prophylactic and therapeutic properties.6
Corchorus depressus Linn leaves reported the isolation of two compounds, flavone and 5-hydroxy flavone, from the chloroform extract of plant leaves.7 These compounds exhibit a diverse array of biological activities, including antioxidant, anticancer and anti-inflammatory, anti-allergic, and analgesic.8 Interestingly, researchers have thoroughly examined the anatomical structures and identified the important secondary metabolites found in the leaves of Corchorus olitorius L.9
However, further research is required to determine the specific therapeutic properties of Corchorus depressus Linn. The present study delineates the structure of four novel compounds obtained from the foliar extracts of Corchorus depressus (Linn.), using methanol and ethanol as extraction solvents. The two compounds isolated from the methanol solvent extract were named ME-1, ME-2 and the two components isolated from the ethanol solvent extracts were named ETH-1 and ETH-2.
Materials and Methods
Collection and Identification of plant
Fresh Corchorus depressus (Linn.) leaves were picked in Sakri, Dhule District, and Maharashtra, India. Taxonomist Dr. S. R. Kshirsagar from S.S.V.P.S’s Science College in Dhule (M.S), India, verified the authenticity of the plant specimen.
Preparation of plant extract
Approximately 3 kg of dried Corchorus depressus (Linn.) leaves were subjected to cold maceration with methanol for 72 hours at ambient temperature. Following the evaporation of the macerate, 7.5 g of methanol extract was obtained. The residual plant material was then subjected to cold maceration with ethanol, a solvent of higher polarity, also at ambient temperature. This process, after evaporation, yielded 4 grams of ethanol extract.10
Isolation of crude compounds
In earlier studies, an initial phytochemical analysis of the crude extracts from Corchorus depressus Linn revealed that the methanol extract contained flavonoids, sterols, and phenolic compounds. In contrast, the ethanol extract confirmed the presence of carbohydrates, glycosides, proteins, and amino acids.11
The TLC systems were developed to identify the potential phytoconstituents present in both crude solvent extracts.
Methanol extract
Thin-layer chromatography (TLC) profile was developed to identify phytosterols and phenolic compounds, as suggested by initial phytochemical tests. Various solvent systems were employed, such as Benzene: Methanol (7:3), Chloroform: Methanol (8:2), Chloroform: Acetone, and Methanol: Water: Formic Acid in different proportions. Significantly, the Chloroform: Acetone (7.5:2.5) and Methanol: Water: Formic Acid (4:5.7:0.3) systems offered improved resolution.
Ethanol extract
In order to develop the thin-layer chromatography (TLC) profile for the ethanol extract, which was intended to identify flavonoids and organic acids as indicated by preliminary phytochemical analyses, a variety of solvent systems were evaluated. These systems included a 7.5:2.5 ratio of Benzene and Ethanol, a 4:3:3 mixture of Benzene, Chloroform, and Ethanol, and several combinations of Petroleum Ether, Ethanol, and Acetic Acid. The best separation was achieved with a 4:4:2 ratio of Petroleum Ether, Ethanol, and Acetic Acid. The spraying reagent was created by dissolving 0.5 g of vanillin in 100 ml of a sulphuric acid/ethanol solution with a 40:10 ratio.
A methanol extract weighing five grams was applied to silica gel with a mesh size of 60-120, and elution was conducted using a solvent system of methanol and acetone in a 7.5:2.5 ratio. This gradient elution process led to the isolation of a single spot. Subsequently, the column was further divided by eluting with a different solvent system comprising methanol, water, and formic acid in a 40:57:3 ratio, which resulted in the isolation of another single spot crude compound. The ethanol extract, weighing 3.5 grams, underwent column chromatography on silica gel with a mesh size of 60-120. It was eluted using a mixture of petroleum ether, ethanol, and acetic acid in a 4:4:2 ratio. Fractions, each displaying a single spot with same Rf values, were combined and evaporated for both the methanol and ethanol extracts, leading to the isolation of compounds.12-15
Purification12, 13
The preparative thin-layer chromatography was conducted on two crude compounds, each derived from the methanol and ethanol extracts of Corchorus depressus Linn. The chromatographic bands were identified, subsequently scraped off, and extracted using the respective solvent. Following evaporation and drying, two pure compounds were obtained from the methanol extracts, designated as ME-1 and ME-2, and from the ethanol extracts, designated as ETH-1 and ETH-2, respectively.
Detection methods
The two isolated pure compounds each from the methanol and ethanol extracts were characterized using established spectroscopic techniques, including CHNS elemental analysis (Flash Smart V, CHNS/O-instrument manufacture by Thermo Fischer Scientific), LCMS (Quadrupole-ToF MS with ESI from Waters QTOF Micro at SAIF, Panjab University, Chandigarh and 6200 series TOF/6500 series from Agilent Technologies at SAIF IIT Bombay), FTIR(Perkin Elmer, USA) at the Sandip Institute of Pharmaceutical Sciences, Nashik and 3000 Hyperion Microscope with Vertex 80 FTIR System (Bruker, Germany) at SAIF IIT Bombay, within the range of 4000–50 cm-1), and 1H, 13C-NMR (BRUKER AVANCE 400 MHz NMR Spectrometer (manufactured by BRUKER, Switzerland) at the Sophisticated Analytical Instrumentation Facility (SAIF) at Panjab University, Chandigarh, as well as an ECZR Series 600 MHz NMR Spectrometer (manufactured by JEOL, Japan) at SAIF, IIT Bombay).
Results
Characterization of ME-1
ME-1 was isolated from methanol extract, appeared as a white amorphous solid with a melting point 128-1300 C. Elemental %: Found C= 84.699 %, H= 11.518 %, O= 3.871 %,
Calculated formula: C29H48O, Molecular weight= 412, MS m/z = 411.55.
IR (cm-1): 3331, 2970, 2934, 2890, 2866, 1458, 1381, 1252, 1153, 1089, 1054, 1022, 969, 960, 799. 1H NMR (CDCl3): δ 0.69 (3H, s, H-18), 0.82(3H, d, H-27), 0.85(3H, t, H-29), 0.93(2H, d, H-28), 0.93(1H, m, H-9), 1.0(1H, m, H-14), 1.02(3H, d, H-26), 1.03(3H,d, H-21), 1.06 (2H, m, H-15), 1.07(3H, s, H-19), 1.13(1H, m, H-17), 1.15(1H, m, H-20), 1.24(2H,m, H-16), 1.44(1H, m, H-25), 1.50(2H, m, H-11), 1.52(1H, m, H-24), 1.56(2H, m, H-15), 1.85(2H, m, H-1), 1.90(2H, m, H-2), 1.98(2H, m, H-7), 1.99(2H, m, H-12), 2.0(1H, m, H-8), 2.25(2H, m, H-4), 3.52(1H, m, H-3), 5.02(1H, dd, H-22), 5.14(1H, dd, H-23), 5.34(1H, t, H-6).
13C NMR (CDCl3): δ 12.06(C-18), 12.29(C-29), 19.00(C-19), 21.08(C-11), 21.08(C-27), 21.13(C-26), 21.25(C-21), 24.38(C-15), 25.44(C-28), 28.96(C-16), 31.60(C-2), 31.61(C-25), 31.90(C-7), 31.90 (C-8), 36.51(C-10), 37.26(C-1), 39.68(C-12), 40.55(C-20), 42.21(C-4), 42.27(C-13), 50.14(C-9), 51.25(C-24), 55.93(C-17), 56.87(C-14), 71.74 (C-3), 121.70 (C-6), 129.25(C-23), 138.35(C-22), 140.76(C-5).
1H and 13C NMR chemical shifts assignments are depicted in the Table 1.
Characterization of ME-2
ME-2, isolated from a methanol extract, was characterized as a yellow crystalline solid with a melting point ranging from 222 to 224°C.
Elemental %: Found C= 59.69 %, H= 4.63 %, O= 35.64 %, Calculated formula: C9H8O4,
Molecular weight=180, MS m/z = 180,
IR (cm-1): 3432, 3233, 1644, 1620, 1527, 1449, 1352, 1277, 1173, 973, 849, 779, 630.
1H NMR (DMSO): δ 6.20 (1H, d, J=15 Hz, H-8), 6.83 (1H, d, J=8 Hz, H-5), 6.90 (1H, dd, J=1.9 Hz & J=8.01 Hz, H-6), 7.07 (1H, d, J=8 Hz, H-2), 7.52 (1H, d, J=15 Hz, H-7),
8.00 (3-OH), 8.10 (4-OH), 13C NMR (DMSO): δ 113.50 (C-2), 114.52 (C-5), 115.02(C-6), 120.91(C-1), 125.81 (C-8), 144.40 (C-7), 144.5(C-3), 147.3(C-4), 168.49(C-9).
The 1H and 13C-NMR chemical shifts assignments are shown in the Table 2.
Characterization of ETH-1
Compound ETH-1 was isolated from an ethanol extract, characterized as an off-white solid with a melting point of 82-84°C.
Elemental %: Found C= 78.109 %, H= 12.997 %, O= 8.894%, Calculated formula: C25H50O2,
Molecular weight= 383. MS m/z = 383.54.
IR (cm-1): 2953, 2915, 2871, 2848, 1694, 1470, 1429, 1410, 1350, 1328, 1301, 1277, 1247, 1193, 936, 722, 685.1H NMR (CDCl3): δ 0.88 (3H, t, H-25), 1.27 (38H, broad s, H-5 to H-23), 1.30 (2H, m, H-24), 1.36 (2H, m, H-4), 1.63 (2H, m, H-3), 2.34 (2H, t, H-2), 11.56 (1H, s, H-1), 13C NMR (CDCl3): δ 14.04(C-25), 22.65(C-24), 24.66(C-3), 29.06(C-8 to C-17), 29.26(C-4, C-5, C-6), 29.40(C-7), 29.40(C-18 to C-22), 31.86(C-23), 34.13(C-2), 180.52 (C-1).
NMR: 1H and 13C NMR chemical shifts assignments are depicted in the Table 3.
Characterization of ETH-2
The compound ETH-2 was isolated from ethanol extract, appeared as a white crystalline solid with a melting point 60-610 C. Elemental %: Found C= 75.03 %, H= 12.109 %, O= 12.854 %,
Calculated formula: C17H34O2, Molecular weight= 271. MS m/z = 271.53
IR (cm-1): 2955, 2918, 2851, 1701, 1466, 1429, 1352, 1326, 1295, 1196, 1121, 1074, 824, 741, 683. 1H NMR (CDCl3): δ 0.89 (3H, t, H-17), 1.27 (22H, broad s, H-6 to H-16), 1.30 (2H, m, H-4), 1.30 (2H, m, H-5), 1.63 (2H, m, H-3), 2.34 (2H, t, H-2), 11.98 (1H, s, H-1).
13C NMR (CDCl3): δ 14.04(C-17), 22.69(C-16), 24.65(C-3), 29.08(C-4), 29.28(C-5), 29.37(C-14), 29.47(C-6), 29.63(C-7 to C-13), 31.93(C-15), 34.12(C-2), 180.69(C-1).
NMR: 1H and 13C NMR chemical shifts assignments are depicted in the Table 4.
Table 1: NMR Spectroscopic Assignments of ME-1
| Position | Carbon type | Multiplicity in 1H NMR | δH (CDCl3) | δC (CDCl3) |
| 1 | CH2 | m | 1.85 | 37.26 |
| 2 | CH2 | m | 1.90 | 31.60 |
| 3 | CH | m | 3.52 | 71.74 |
| 4 | CH2 | m | 2.25 | 42.21 |
| 5 | C=C | 140.76 | ||
| 6 | =CH | t | 5.34 | 121.70 |
| 7 | CH2 | m | 1.98 | 31.90 |
| 8 | CH | m | 2.00 | 31.90 |
| 9 | CH | m | 0.93 | 50.14 |
| 10 | C | 36.51 | ||
| 11 | CH2 | m | 1.50 | 21.08 |
| 12 | CH2 | m | 1.99 | 39.68 |
| 13 | C | 42.27 | ||
| 14 | CH | m | 1.00 | 56.87 |
| 15 | CH2 | m | 1.06 , 1.56 | 24.38 |
| 16 | CH2 | m | 1.24 | 28.96 |
| 17 | CH | m | 1.13 | 55.93 |
| 18 | CH3 | s | 0.69 | 12.06 |
| 19 | CH3 | s | 1.07 | 19.00 |
| 20 | CH | m | 1.15 | 40.55 |
| 21 | CH3 | d | 1.03 | 21.25 |
| 22 | =CH | dd | 5.02 | 138.35 |
| 23 | =CH | dd | 5.14 | 129.25 |
| 24 | CH | m | 1.52 | 51.25 |
| 25 | CH | m | 1.44 | 31.61 |
| 26 | CH3 | d | 1.02 | 21.13 |
| 27 | CH3 | d | 0.82 | 21.08 |
| 28 | CH2 | d | 0.93 | 25.44 |
| 29 | CH3 | t | 0.85 | 12.29 |
Table 2: NMR Spectroscopic Assignments of ME-2
| Position | Carbon type | Multiplicity in 1H NMR | δH (DMSO) | δC (DMSO) |
| 1 | Ar.-C | 120.91 | ||
| 2 | Ar.-CH | d | 7.07 | 113.50 |
| 3 | Ar.-OH | br. s | 8.00 | 144.50 |
| 4 | Ar.-OH | br. s | 8.10 | 147.30 |
| 5 | Ar.-CH | d | 6.83 | 114.52 |
| 6 | Ar.-CH | dd | 6.90 | 115.02 |
| 7 | =CH | d | 7.52 | 144.40 |
| 8 | =CH | d | 6.20 | 125.81 |
| 9 | COOH | 168.49 |
Table 3: NMR Spectroscopic Assignments of ETH-1
| Position | Carbon type | Multiplicity in 1H NMR | δH (CDCl3) | δC (CDCl3) |
| 1 | COOH | s | 11.56 | 180.52 |
| 2 | CH2 | t | 2.34 | 34.13 |
| 3 | CH2 | m | 1.63 | 24.66 |
| 4 | CH2 | m | 1.36 | 29.26 |
| 5 | CH2 | br. s | 1.27 | 29.26 |
| 6 | CH2 | br. s | 1.27 | 29.26 |
| 7 | CH2 | br. s | 1.27 | 29.40 |
| 8 | CH2 | br. s | 1.27 | 29.06 |
| 9 | CH2 | br. s | 1.27 | 29.06 |
| 10 | CH2 | br. s | 1.27 | 29.06 |
| 11 | CH2 | br. s | 1.27 | 29.06 |
| 12 | CH2 | br. s | 1.27 | 29.06 |
| 13 | CH2 | br. s | 1.27 | 29.06 |
| 14 | CH2 | br. s | 1.27 | 29.06 |
| 15 | CH2 | br. s | 1.27 | 29.06 |
| 16 | CH2 | br. s | 1.27 | 29.06 |
| 17 | CH2 | br. s | 1.27 | 29.06 |
| 18 | CH2 | br. s | 1.27 | 29.40 |
| 19 | CH2 | br. s | 1.27 | 29.40 |
| 20 | CH2 | br. s | 1.27 | 29.40 |
| 21 | CH2 | br. s | 1.27 | 29.40 |
| 22 | CH2 | br. s | 1.27 | 29.40 |
| 23 | CH2 | br. s | 1.27 | 31.86 |
| 24 | CH2 | m | 1.30 | 22.65 |
| 25 | CH3 | t | 0.88 | 14.04 |
Table 4: NMR Spectroscopic Assignments of ETH-2
| Position | Carbon type | Multiplicity in 1H NMR | δH (CDCl3) | δC (CDCl3) |
| 1 | COOH | s | 11.98 | 180.69 |
| 2 | CH2 | t | 2.34 | 34.12 |
| 3 | CH2 | m | 1.63 | 24.65 |
| 4 | CH2 | m | 1.30 | 29.08 |
| 5 | CH2 | m | 1.30 | 29.28 |
| 6 | CH2 | br. s | 1.27 | 29.47 |
| 7 | CH2 | br. s | 1.27 | 29.63 |
| 8 | CH2 | br. s | 1.27 | 29.63 |
| 9 | CH2 | br. s | 1.27 | 29.63 |
| 10 | CH2 | br. s | 1.27 | 29.63 |
| 11 | CH2 | br. s | 1.27 | 29.63 |
| 12 | CH2 | br. s | 1.27 | 29.63 |
| 13 | CH2 | br. s | 1.27 | 29.63 |
| 14 | CH2 | br. s | 1.27 | 29.37 |
| 15 | CH2 | br. s | 1.27 | 31.93 |
| 16 | CH2 | br. s | 1.27 | 22.69 |
| 17 | CH3 | t | 0.89 | 14.04 |
Discussion
Compound ME-1 showed a green color in Libermann-Burchard’s test, depicting the compound of the steroid nucleus.16, 17 ME-1’s mass peak (m/z-411.61) and elemental analysis (C= 84.699 %, H= 11.518 %, O= 3.871 %) indicated that its chemical formula was C29H48O. The IR spectral data of ME-1 showed at broad spectrum at 3331 cm-1 represents the –OH group. The absorption peaks at 2970 cm-1 represents-CH alkene , 2934 cm-1, 2866 cm-1 and 1458 cm-1 peaks showed -CH aliphatic group and 1154 cm-1 for C-O linkage.1H NMR spectrum of ME-1 showed the signal at 5.35 (triplet, 1H) for the H-6, a mono-substituted olefin proton. The two doublet of doublets at 5.02 δ and 5.14 δ constituted the H-22 and H-23 protons of the di-substituted olefin. The signal at 3.52 (m) suggests a downfield shift of proton H-3 of the steroidal moiety. ME-1 shows singlets at 0.69 δ and 1.07 δ corresponding to two methyl groups of H-18 and H-19, and three doublets at 1.03 δ, 0.82 δ and 0.85 δ suggesting the three methyl groups of H-21, H-27, and H-29, respectively. On studying all the spectroscopic assignments of 1H-NMR data and 13C NMR signals, MS data of the compound ME-1 (Figure 2) and on comparison with the previous literature, 18 the structure of the compound was identified as stigmasterol.
ME-2; showed a mass peak at m/z= 180 and elemental analysis (C =59.69 %, H=4.63 %, O=35.64 %) revealed its formula to be C9H8O4. In the IR spectrum, the broad peak at 3431cm-1 represents the O-H stretching vibration of the phenolic group. The stretching frequency at 1644 cm-1 indicated the –C=O group of carboxylic acid and the 1620 cm-1 peak indicted the C=C of the aromatic ring. The 1H-NMR spectra of ME-2 , doublet of doublet at 6.90 δ represents the H-6 proton with ortho and meta coupling(J=8 Hz and J=1.9Hz), and two doublets at 7.07 δ and 6.83 δ indicates the H-2 and H-5 protons respectively. Also two broad doublets at 6.2 δ and 7.5 δ (J=15 Hz) depicted two double bonded carbons, α and β, respectively to the carboxylic acid group. On comparing all the spectroscopic assignments and comparing all the spectral data (Figure 3), with the previous literature, 19 the structure of the compound was elucidated as caffeic acid.
ETH-1 compound, a crystalline solid with a melting point of 82-840C, was obtained from the ethanol extract. The mass peak (m/z-383.54) and elemental analysis (C= 78.109 %, H= 12.997 %, O= 8.894 %) resulted in the chemical formula C25H50O2. The IR spectra of ETH-1 showed absorption bands at 2953 cm-1(broad, O-H str.), 2848 cm-1 (C-H str.), 1694 cm-1 (C=O), 1350, 1328, 1277, 1193, 936, 722, 685 cm-1 indicate that it is long chain saturated fatty acid. 1H NMR spectrum of ETH-1 showed at downfield peak at 11.56 δ endorsing the presence of a carboxylic acid proton. In addition, a three proton triplet at 0.88 δ representing the terminal methyl protons, a broad singlet at 1.27 δ assignable to 44-methylene protons and a sharp triplet of two protons at 2.34 δ corresponds to the methylene group α-(next) to the carboxylic acid functional group. Based on all the spectroscopic assignments of 1H-NMR data and 13C NMR signals and from the mass peak at m/z- 383 of compound ETH-1 (Figure 4), the structure of the compound was determined to be pentacosylic acid.
ETH-2 compound, a white crystalline solid with a melting point of 60-610C, was obtained from the ethanol extract. The mass peak (m/z-271.53) and elemental analysis (C= 75.03 %, H= 12.109 %, O= 12.854 %) resulted in the chemical formula C17H34O2. IR spectrum of ETH-2 showed peaks at 2955 cm-1 (OH-str.), 2850 cm-1 (CH- str.) and 1701 cm-1 (C=O).
1H NMR spectrum of ETH-2 showed at downfield peak at 11.98 δ revealed the presence of a carboxylic acid proton. The three-proton triplet at 0.88 δ showed a terminal methyl group, and a broad singlet at 1.27 δ depicts the 26-methylene protons and a sharp triplet of two protons at 2.34 δ corresponding to the α-methylene group.
Considering all the NMR spectroscopic assignments and the mass peak at m/z-271.53 (Figure 5), the structure of the ETH-2 compound was identified as margaric acid.
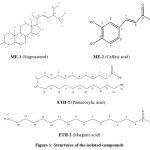 |
Figure 1: Structures of the isolated compounds |
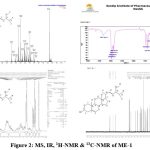 |
Figure 2: MS, IR, 1H-NMR & 13C-NMR of ME-1 |
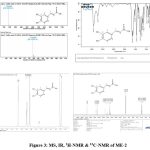 |
Figure 3: MS, IR, 1H-NMR & 13C-NMR of ME-2 |
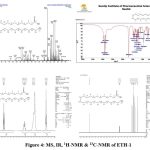 |
Figure 4: MS, IR, 1H-NMR & 13C-NMR of ETH-1 |
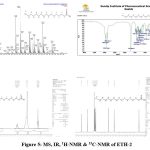 |
Figure 5: MS, IR, 1H-NMR & 13C-NMR of ETH-2 |
Conclusion
From the leaves of Corchrous depressus (Linn.), two biologically active compounds were extracted using methanol, and another two were obtained using ethanol. The identification of these isolated compounds’ structures was achieved by comparing their spectroscopic data with that available in the existing literature. According to the spectral analysis, the compounds ME-1, ME-2, ETH-1, and ETH-2 were identified as stigmasterol, caffeic acid, pentacosylic acid, and margaric acid, respectively.
Acknowledgement
The authors extend their sincere thanks to the Principal of Sandip Institute of Technology and Research Centre, Nashik, for providing the necessary facilities. Furthermore, the research was made possible through the support of the Principal of P.S.G.V.P. Mandal’s S.I.Patil Arts, G.B.Patel Science, and S.T.K.V.S Commerce College, Shahada, District-Nandurbar, who offered the crucial research infrastructure.
Funding Sources
The author(s) received no financial support for the research, authorship, and/or publication of this article.
Conflict of Interest
The authors do not have any conflict of interest.
Data Availability Statement
This statement does not apply to this article.
Ethics Statement
This research did not involve human participants, animal subjects, or any material that requires ethical approval.
Informed Consent Statement
This study did not involve human participants, and therefore, informed consent was not required.
Clinical Trial Registration
This research does not involve any clinical trials.
Permission to reproduce material from other sources –
Not Applicable
Authors Contribution
Swapnil Ghanshyam Dhake: Conceptualization, Methodology, Writing – Original Draft.
Milind Kashinath Patel: Data Collection, Analysis, Writing – Review & Editing.
References
- Kunwar R. M, Acharya R. P, Chowdhary C. L, and Bussmann R. W, Medicinal plant dynamics in indigenous medicines in farwest Nepal. Journal of Ethnopharmacology, 2015; 163: 210–219. https://doi.org/10.1016/j.jep.2015.01.035
CrossRef - Che C. T, George V, Ijinu T. P, Pushpangadan P, and Andrae-Marobela K, Chapter 2 – Traditional medicine in Pharmacognosy; Elsevier; 2023:11–28. https://doi.org/10.1016/b978-0-443-18657-8.00037-2
CrossRef - World Health Organization. WHO Global Report on Traditional and Complementary Medicine 2019. Geneva: World Health Organization; 2019; ISBN: 978-924-151543-6.
- Nath R, Sarma G, Nath D, Talkudar A. D, and Kityania S, An extensive review on medicinal plants in the special context of economic importance. Asian Journal of Pharmaceutical and Clinical Research, 2023; 6(2):6-11. https://doi.org/10.22159/ajpcr.2023.v16i2.46073
CrossRef - Rizvi SA A, Einstein GP, Tulp O, Sainvil F, Branly R. “Introduction to Traditional Medicine and Their Role in Prevention and Treatment of Emerging and Re-Emerging Diseases.” Biomolecules. 2022; 12(10):1442. Doi:10.3390/biom12101442.
CrossRef - Kumari N, Choudhary S. B, Sharma H. K, Singh B. K, and Kumar A. A, Health-promoting properties of Corchorus leaves: A review, Journal of Herbal Medicine. 2018; 15:100240. https://doi.org/10.1016/ j.hermed.2018.10.005.
CrossRef - Dhake S. G, Patel M. K, Isolation and Characterization of Phytoconstituents from the Chloroform Extract of Corchorus depressus (Linn.) Leaves. Indian Journal of Natural Sciences, 2025; 15(88):89433- 89438.
- Biswas A, Dey S, Akhter D, Huang S, Birhanie Z. M, Deng Y, Zhang J, Liu L, and Li D, A Comprehensive Review of C. capsularis and C. olitorius: A Source of Nutrition, Essential Phytoconstituents and Pharmacological Activities, Antioxidants, 2022; 11(7):1358. https://doi.org/10.3390/antiox11071358
CrossRef - Atlı, B., Öztinen, N., Ak Sakallı, E., Topalkara, R. B., & Koşar, M, Microscopic Evaluation and Qualitative Phytochemical Screening of Corchorus olitorius L. (Molokhia) Leaves. EMU Journal of Pharmaceutical Sciences, 2024; 7(3):90-97. https://doi.org/10.54994/emujpharmsci.1595726
CrossRef - Dharajiya D, Pagi N, Jasani H, & Patel P, Antimicrobial Activity and Phytochemical Screening of Aloe vera (Aloe barbadensis Miller), International Journal of Current Microbiology and Applied Sciences, 2017; 6(3): 2152-2162.https://doi.org/10.20546/ijcmas.2017.603.246
CrossRef - Patel, M. K, and Dhake S. G, Preliminary Phytochemical, Physicochemical and Biological Study of Corchorus depressus (Linn.) leaves. Microbial Science Archives, 2023; 3(1):32-37. https://doi.org/10.47587/MSA.2023.3106.
- Annadurai P, Extraction and isolation of bioactive compounds from Lantana camara leaves by column chromatographic techniques. Research Journal of Pharmacy and Technology, 2021; 14(3):1607–1611. https://doi.org/10.5958/0974-360X.2021.00285.7
CrossRef - Gaurav S, Sharma, P, & Verma A, Chromatography techniques for isolation of phytoconstituents from medicinal plants. In Futuristic Trends in Pharmacy & Nursing, 2024; (Vol. 3, Book 9, Chapter 23). IIP Series.
- Erwin E, Pusparohmana WR, Sari IP et al.Phytochemical and antioxidant activity evaluation of the bark of Tampoi (Baccaurea macrocarpa), F1000Research 2018; 7:1977 (https://doi.org/10.12688/ f1000research.16643.1)
CrossRef - Salar S, Gautam S, & Zahiruddin M, Chromatography techniques for isolation of phytoconstituents from medicinal plants. In Futuristic Trends in Pharmacy & Nursing, 2024; (Vol. 3, Book 9, Chapter 23). IIP Series. https://iipseries.org/assets/docupload/rsl2024167A5D487B23D04.pdf
- Kafelau M, Kopon A. M, Baunsele A. B, Tukan M. B, Leba M. U, Komisia F, & Boelan E. G, Phytochemical screening and TLC profiling of combination extracts of avocado (Persea americana Mill.) and papaya (Carica papaya) leaves from Timor Island. Indonesian Journal of Chemical Research, 2022; 10(1):32–37. http://ojs3.unpatti.ac.id/index.php/ijcr
CrossRef - Arshad M, Khan M. A, & Khan M. I, Inhibition potential of steroidal compounds from Nerium oleander against α-glucosidase and α-amylase enzymes. Journal of Enzyme Inhibition and Medicinal Chemistry, 2017; 32(1):1–9. https://doi.org/10.1080/14756366.2017.1373964
- Erwin W.R. Pusparohmana R.D. Safitry E, Marliana, Usman and I.W. Kusuma, Isolation and characterization of stigmasterol and β-sitosterol from wood bark extract of Baccaurea macrocarpa Miq. Mull. Arg; Rasayan J. Chem, 2020; 13(4):2552–2558. http://dx.doi.org/10.31788/RJC.2020. 1345652
CrossRef - Irma BYN, Jaures ANK, Florence DM, Isolation, characterization and structural elucidation of eight known phenolic compounds from Lycium ruthenicum Murr., IOSR Journal of Applied Chemistry, 2021, 14(6):13-27. DOI: 10.9790/5736-1406011327.
Abbreviations List
ME-1: Methanol Extract-1
ME-2: Methanol Extract-2
ETH-1: Ethanol Extract-1
ETH-2: Ethanol Extract-2
PTLC-Preparative TLC, IR-Infrared Spectroscopy
MS-Mass spectrometry
1H-NMR: Hydrogen nuclei Nuclear Magnetic Resonance
13C-NMR: Carbon nuclei Nuclear Magnetic Resonance

This work is licensed under a Creative Commons Attribution 4.0 International License.


