

Manuscript accepted on : 11-09-2025
Published online on: 18-09-2025
Plagiarism Check: Yes
Reviewed by: Dr. Eman Mahmood
Second Review by: Dr. Anji
Final Approval by: Dr. Wagih Ghannam
Madhu Reddemma1*, Pratyusha Valligatla1, Sivagami Bojan1, Sunil Kumar Ellampati1 , Mounika Tummalapalli 2, Charumathi Salva3and Chandrasekar Raju1
1Department of Pharmaceutical Chemistry, Seven Hills College of Pharmacy (Autonomous), Andhrapradesh, India.
2Department of Pharmaceutical Chemistry¸ Acharya Nagarjuna University, Guntur, India
3Department of Pharmaceutical Analysis, RBVRR Womens College of Pharmacy,Telangana, India.
Corresponding Author E-mail:chandru@shcptirupati.edu.in
ABSTRACT: A sensitive and robust UPLC method was developed and validated for the simultaneous analysis of bempedoic acid and ezetimibe in drug substance and drug product. Chromatographic conditions were accomplished using a UPLC (Acquity) CSH C18 column (100 × 2.1 mm, 1.7 μm) under isocratic conditions, utilizing a movable phase comprising of acetonitrile and heptane sulphonic acid buffer (pH 2.5) /OPA in a 5:95 v/v ratio. The absorption wavelength was set at 232 nm, with a flow rate of 0.5 mL/min. International Council for Harmonisation Q2(R1) standards were used for method optimization and included stress studies. The retention times for bempedoic acid and ezetimibe were 0.365 and 1.326 minutes, respectively. The method demonstrated a regression coefficient (R² > 0.999), ruggedness (% RSD < 2%), recovery range (between 98–102%) and robustness. The LOD was 0.54 μg/mL for bempedoic acid and 0.03 μg/mL for ezetimibe. Both compounds exhibited sensitivity to acidic, oxidative, and thermal degradation, confirming the stability-indicating method of the compounds. Overall, the developed UPLC method is precise, accurate, specific, and suitable for quality analysis and stability assessment of bempedoic acid and ezetimibe in both drug substances and drug products.
KEYWORDS: Bempedoic Acid; Ezetimibe; ICH; Method Development; Stability Assessment; Simultaneous Quantification; UPLC; Validation
| Copy the following to cite this article: Reddemma M, Valligatla P, Bojan S, Ellampati S. K, Tummalapalli M, Salva C, Raju C. Quantification of Bempedoic Acid and Ezetimibe with Comprehensive Stability Assessment in Drug Substance and Drug Product by UPLC. Biotech Res Asia 2025;22(3). |
| Copy the following to cite this URL: Reddemma M, Valligatla P, Bojan S, Ellampati S. K, Tummalapalli M, Salva C, Raju C. Quantification of Bempedoic Acid and Ezetimibe with Comprehensive Stability Assessment in Drug Substance and Drug Product by UPLC. Biotech Res Asia 2025;22(3). Available from: https://bit.ly/4nsSMmV |
Introduction
Bempedoic acid is a lipid-lowering agent that acts as an ATP citrate lyase (ACL) inhibitor.1 It reduces cholesterol biosynthesis in the liver, thereby lowering low-density lipoprotein cholesterol (LDL-C). It is particularly beneficial for patient’s intolerant to statins.2,3 Figure 1: Shows the structure of Bempedoic acid.
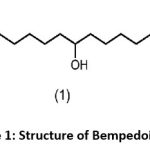 |
Figure 1: Structure of Bempedoic acid |
Ezetimibe is a cholesterol absorption inhibitor that blocks the Niemann–Pick C1-like 1 (NPC1L1) transporter in the intestinal brush border. This reduces the absorption of dietary and biliary cholesterol, complementing other lipid-lowering therapies. The combination of Bempedoic acid and Ezetimibe has demonstrated synergistic effects in the management of hyperlipidemia4 Figure. 2 Represents the structure of Ezetimibe
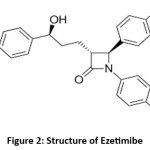 |
Figure 2: Structure of Ezetimibe |
Few analytical methods are available that can accurately quantify both compounds simultaneously with high sensitivity and speed. Ultra-Performance Liquid Chromatography (UPLC) is an advanced chromatographic technique that offers superior resolution, sensitivity, and speed compared to conventional HPLC. UPLC provides high efficiency and reduces analysis time, making it an ideal tool for pharmaceutical method development and validation.4,5
Thus, the present work focuses on the development and validation of a simple, precise, and robust UPLC method for the simultaneous estimation of bempedoic acid and ezetimibe in bulk and pharmaceutical dosage forms, in accordance with ICH guidelines. The ICH standards were followed for development and validation of the method and subjected to stress degradation under various stress tests to ensure its applicability for stability analysis.
Materials and Methods
Chemicals and Reagents
Bempedoic acid and ezetimibe pure drug samples were obtained from Shree Icon Pharmaceutical Laboratories Research centre Vijayawada. Acetonitrile, (HPLC grade, Merck, India) heptane sulfonic acid and ortho-phosphoric acid (AR grade, Merck, India) were used for the analysis. All other reagents and chemicals employed were of either analytical reagent (AR) grade or HPLC grade. High-purity Milli-Q water was used throughout the method for solution preparation and mobile phase composition.
Instrumentation
The chromatographic separation was performed on an ACQUITY UPLC system (Waters) equipped with Empower software version 2.0. A digital pH meter (Eutech) was used for pH adjustments. Weighing of samples was carried out using an analytical balance (Sartorius). A UV/VIS spectrophotometer (model UV-1700) and an ultrasonicator (model UCA 701, Unichrome) were employed during the study. Additionally, an isocratic pump model was used to maintain consistent flow rates during the chromatographic runs.
Selection of Detection Wavelength (λmax)
A mixture of ACN and heptane sulfonic acid (pH 2.5) in a 5:95 ratio was used as the solvent. The drug mixture was scanned in the 200–400 nm range using a PDA detector, and the isosbestic point was identified at 232 nm. This wavelength was thus selected for detection in the UPLC method. Figure 3 Represents PDA – Spectrum of Bempedoic acid and Ezetimibe.
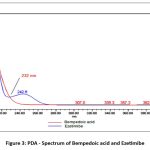 |
Figure 3: PDA – Spectrum of Bempedoic acid and Ezetimibe |
Chromatographic Conditions
Numerous trials were conducted to determine the most suitable chromatographic conditions. After optimization, the best set of parameters was chosen for consistent and effective separation of the analytes.
Preparation of Standard Solution
Accurately weigh 18 mg of bempedoic acid and 10 mg of eze working standards and transfer them into a clean 10 mL volumetric flask. Add about 7 mL of diluent and sonicate the mixture to achieve complete dissolution, then make up the volume to the 10 mL mark with the same diluent. From this stock solution, pipette 1 mL into a separate 10 mL volumetric flask and dilute to the mark. Additionally, mix 1 mL each of the bempedoic acid and ezetimibe stock solutions in another 10 mL volumetric flask and dilute to the mark. The final concentrations of 180 ppm for BA and 10 ppm for Eze.
Preparation of Sample Solution
Accurately weigh 23 mg of the sample containing both bempedoic acid and ezetimibe and transfer it into a 10 mL volumetric flask. Add the required volume of diluent and sonicate the mixture for 30 minutes to facilitate dissolution. After sonication, centrifuge the solution for 30 minutes to ensure clarity. Finally, make up the volume to the 10 mL mark with diluent and filter the solution through a 0.22 µm membrane filter prior to analysis.
General Preparations
Preparation of Heptane Sulfonic Acid Buffer
Dissolve 1.8 g of heptane sulfonic acid in 1 L to bring the pH to 2.5 using (OPA). Clarify the solution to eliminate particulate matter.
Preparation of Mobile Phase
The mobile phase was prepared by mixing the ACN and heptane sulfonic acid buffer (pH 2.5, adjusted with OPA) a ratio 95:5 (v/v). The mixture was then filtered to remove any impurities that might interfere with chromatographic performance.
Method Validation Parameters
The developed UPLC method was validated as per the (ICH) standards Q2(R1), addressing the following key parameters:
System Suitability
The system suitability studies were satisfied as the theoretical plate count exceeded 2000, the tailing factor remained below 2, and the resolution between the peaks was greater than 2.⁶ ⁷
Specificity
The developed method proved to be highly specific, as it clearly distinguished the analytes from excipients, degradation products, and possible impurities. Chromatograms of blank and placebo samples showed no interfering peaks at the retention times of BA and Eze.8,9
Linearity
Calibration curves were prepared for BA (45–270 µg/mL) and Eze (2.5–15 µg/mL). Both analytes exhibited excellent linearity with correlation coefficients (R²) of 0.99989 and 0.99981, respectively.
Precision
System precision was confirmed as six replicate injections of the standard gave %RSD values below 2% for both drugs. Method precision (repeatability) with six sample preparations showed %RSD values of 0.90% for BA and 0.55% for Eze. Intermediate precision, evaluated through day-to-day variability, also met the acceptance criteria.¹⁰ ¹¹
Accuracy
Recovery studies at 50%, 100%, and 150% levels yielded mean recoveries of 100.3% for BA and 99.9% for Eze, which fall within the acceptable recovery range of 98–102%, confirming the method’s accuracy.¹² ¹³
Robustness
Robustness testing was carried out by making small variations in the flow rate (±0.05 mL/min) and the organic phase ratio (±0.5%). These deliberate changes produced %RSD values less than 2%, establishing the robustness of the method.¹⁴,¹⁵
LOD and LOQ
The limits of detection and quantification were calculated using the ICH formulae:
LOD = 3.3 × σ/S
LOQ = 10 × σ/S
For bempedoic acid, the LOD and LOQ were 0.54 µg/mL and 1.80 µg/mL, respectively, whereas for ezetimibe, the LOD was 0.03 µg/mL and the LOQ was 0.10 µg/mL. These values indicate the high sensitivity of the developed method.¹⁶,¹⁷
Results
System Suitability
Retention time for bempedoic acid was 0.365 min, ezetimibe was 1.326 min, theoretical plates were >8000, tailing factor was <1.2 and resolution was >9. The results are summarized in Table 1. Figure 4 Displays blank and standard chromatogram for bempedoic acid and ezetimibe.
Table 1: System suitability parameters for Bempedoic acid and Ezetimibe
| S.no | Parameter | Bempedoic acid | Ezetimibe |
| 1 | Retention time | 0.365 | 1.326 |
| 2 | Theoretical plates | 14875 | 8320 |
| 3 | Tailing factor | 1.15 | 0.88 |
| 4 | Resolution | — | 9.45 |
| 5 | %RSD | 0.98 | 1.31 |
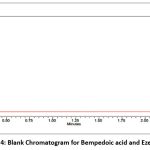 |
Figure 4: Blank Chromatogram for Bempedoic acid and Ezetimibe |
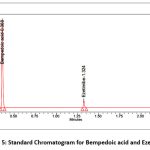 |
Figure 5: Standard Chromatogram for Bempedoic acid and Ezetimibe |
Specificity
Specificity was confirmed by the absence of interference peaks at the retention time of analytes in the blank and placebo chromatograms.
Precision
For system precision, % RSD for BA is 0.98% and Eze is 1.31%. In method precision (repeatability), % RSD for BA is 0.90%, and Eze is 0.55%. Intermediate Precision (Day-to-Day) % RSD is <1.3 for both drugs. Table 2 summarizes system precision results of BA and Eze. Table 3 Method Precision Data for BA and Eze Table 4 Presents intermediate precision (day variation) for BA and Eze.
Table 2: System precision table of Bempedoic acid and Ezetimibe
| S. No | Concentration Bempedoic acid (µg/ml) | Area of
Bempedoic acid |
Concentration of Ezetimibe
(µg/ml) |
Area of
Ezetimibe |
| 1. | 180 | 2254187 | 10 | 122840 |
| 2. | 180 | 2236410 | 10 | 121682 |
| 3. | 180 | 2208641 | 10 | 124874 |
| 4. | 180 | 2217413 | 10 | 123564 |
| 5. | 180 | 2234512 | 10 | 122462 |
| 6. | 180 | 2267451 | 10 | 120158 |
| Mean | 2236436 | 122597 | ||
| SD | 21978.020 | 1611.400 | ||
| %RSD | 0.98 | 1.31 | ||
Table 3: Method Precision for Bempedoic acid and Ezetimibe
| S. No. | Area for Bempedoic acid | Area for Ezetimibe |
| 1 | 2218460 | 123487 |
| 2 | 2214587 | 122132 |
| 3 | 2256974 | 123652 |
| 4 | 2251478 | 123461 |
| 5 | 2261058 | 123054 |
| 6 | 2231476 | 122187 |
| Average | 2239006 | 122996 |
| Standard Deviation | 20198.104 | 677.050 |
| %RSD | 0.90 | 0.55 |
Table 4: Intermediate Precision (Day variation) for Bempedoic acid and Ezetimibe
| S. No. | Area for Bempedoic acid | Area for Ezetimibe | ||
| Day-1 | Day-2 | Day-1 | Day-2 | |
| 1 | 2210369 | 2263140 | 123045 | 125364 |
| 2 | 2240178 | 2271036 | 122368 | 124632 |
| 3 | 2236204 | 2256418 | 125132 | 123459 |
| 4 | 2254123 | 2201436 | 123925 | 122874 |
| 5 | 2210632 | 2210547 | 122024 | 121850 |
| 6 | 2240165 | 2245178 | 123236 | 125450 |
| Average | 2231945 | 2241293 | 123288 | 123938 |
| Standard Deviation | 17692.491 | 28773.923 | 1123.562 | 1450.692 |
| %RSD | 0.79 | 1.28 | 0.91 | 1.17 |
Linearity
Regression line of BA was 45–270 µg/mL (R² = 0.99989), and Eze was 2.5–15 µg/mL (R² = 0.99981). Table 5 Summarizes the results of linearity for BA and Eze, Figure 6 Shows the Calibration curve for Bempedoic acid and Figure 7 displays the Calibration curve for Ezetimibe.
Table 5: Results of linearity for Bempedoic acid and Ezetimibe
| S.NO | Bempedoic acid | Ezetimibe | ||
| Conc.(µg/ml) | Peak area | Conc.(µg/ml) | Peak area | |
| 1 | 45.00 | 563546 | 2.50 | 30710 |
| 2 | 90.00 | 1127093 | 5.00 | 61420 |
| 3 | 135.00 | 1690639 | 7.50 | 94130 |
| 4 | 180.00 | 2254187 | 10.00 | 122840 |
| 5 | 225.00 | 2817733 | 12.50 | 153550 |
| 6 | 270.00 | 3321280 | 15.00 | 181260 |
| Regression equation | y =12380.40x + 10713.86 | y = 12155.43x + 821.43 | ||
| Slope | 12380.40 | 12155.43 | ||
| Intercept | 10713.86 | 821.43 | ||
| R2 | 0.99989 | 0.99981 | ||
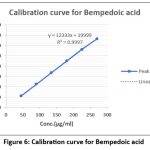 |
Figure 6 Calibration curve for Bempedoic acid |
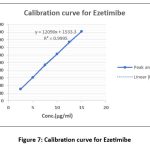 |
Figure 7 Calibration curve for Ezetimibe |
Accuracy
Mean recovery for BA is 100.3% and Eze is 99.9%. Recovery range within 98–102% for all levels. Table 6 and Table 7 Summarizes the Accuracy results of Bempedoic acid and Ezetimibe.
Table 6: Accuracy results of Bempedoic acid
| %Concentration | Response | Amount Added
(mg) |
Amount Found
(mg) |
% Recovery | Mean Recovery |
| 50% | 1115729 | 9.00 | 8.98 | 99.8 | 100.3 |
| 1123105 | 9.00 | 9.04 | 100.4 | ||
| 1126941 | 9.00 | 9.07 | 100.8 | ||
| 100% | 2231458 | 18.00 | 17.96 | 99.8 | 100.4 |
| 2241305 | 18.00 | 18.04 | 100.2 | ||
| 2265841 | 18.00 | 18.24 | 101.3 | ||
| 150% | 3347187 | 27.00 | 26.94 | 99.8 | 100.0 |
| 3352694 | 27.00 | 26.98 | 99.9 | ||
| 3365321 | 27.00 | 27.09 | 100.3 |
Table 7: The Accuracy results for Ezetimibe
| %Concentration | Response | Amount Added
(mg) |
Amount Found
(mg) |
% Recovery | Mean Recovery |
| 50% | 61421 | 0.5 | 0.501 | 100.2 | 99.9 |
| 61132 | 0.5 | 0.499 | 99.8 | ||
| 61230 | 0.5 | 0.499 | 99.8 | ||
| 100% | 120648 | 1.0 | 0.984 | 98.4 | 99.3 |
| 121870 | 1.0 | 0.994 | 99.4 | ||
| 122541 | 1.0 | 1.000 | 100.0 | ||
| 150% | 182472 | 1.5 | 1.488 | 99.2 | 100.1 |
| 183642 | 1.5 | 1.498 | 99.9 | ||
| 186403 | 1.5 | 1.520 | 101.3 |
Robustness
Method was robust against small variations in flow rate and organic phase. All % RSD values <2%. Table 8 and Table 9 Represents the Robustness results of BAand Robustness results of Eze.
Table 8: Robustness results of Bempedoic acid
| Parameter | Bempedoic acid | ||||||
| Condition | Retention time(min) | Peak area | Resolution | Tailing | Plate count | % RSD | |
| Flow rate
Change (mL/min) |
Less flow(0.45ml) | 0.468 | 2031732 | – | 1.19 | 14753 | 0.76 |
| Actual(0.50ml) | 0.365 | 2254187 | – | 1.15 | 14815 | 0.98 | |
| More flow(0.55ml) | 0.273 | 2351468 | – | 1.11 | 14956 | 0.70 | |
| Organic Phase change | Less Org (4.5:95.5) | 0.563 | 1945328 | – | 1.21 | 14623 | 0.60 |
| Actual (5:95) | 0.368 | 2236410 | – | 1.12 | 14898 | 0.98 | |
| More
Org (5.5:94.5) |
0.186 | 2540187 | – | 1.09 | 15021 | 1.11 | |
Table 9: Robustness results of Ezetimibe
| Parameter | Ezetimibe | ||||||
| Condition | RT (min) | Peak area | Resolution | Tailing | Plate count | % RSD | |
| Flow rate
Change(mL/min) |
Less flow(0.45ml) | 1.541 | 114230 | 10.17 | 0.92 | 8121 | 1.26 |
| Actual(0.50ml) | 1.326 | 122840 | 9.42 | 0.88 | 8320 | 1.31 | |
| More flow(0.55ml) | 1.225 | 131524 | 9.33 | 0.85 | 8475 | 0.62 | |
|
Organic Phase change |
Less Org (4.5:95.5) | 1.601 | 96146 | 9.88 | 0.99 | 8063 | 0.63 |
| Actual (5:95) | 1.324 | 121682 | 9.44 | 0.86 | 8369 | 1.31 | |
| More
Org (5.5:94.5) |
1.011 | 143210 | 8.21 | 0.81 | 8566 | 1.00 | |
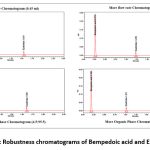 |
Figure 8: Robustness chromatograms of Bempedoic acid and Ezetimibe |
LOD and LOQ
The LOD was 0.54 and 1.80 for BA and the LOQ was 0.03 and 0.10 for Eze. Table 10 summarizes the sensitivity parameters (LOD & LOQ) by UPLC.
Table 10: Sensitivity parameters (LOD & LOQ)
| Drug Name | LOD(µg/ml) | s/n | LOQ(µg/ml) | s/n |
| Bempedoic acid | 0.54 | 3 | 1.80 | 10 |
| Ezetimibe | 0.03 | 3 | 0.10 | 10 |
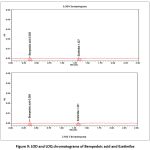 |
Figure 9: LOD and LOQ chromatograms of Bempedoic acid and Ezetimibe |
Stress Degradation Study
The analytes were exposed to a range of stress conditions in accordance with ICH Q1A(R2) in order to demonstrate the methods stability-indicating assessment.
Acid Hydrolysis
Stock solution of 1 mL of was mixed with 1 mL of 1N HCl and heated at 60°C for one hour. After neutralization with 1N NaOH, the solution was diluted with diluent to the required volume and filtered prior to analysis. ¹⁸
Alkali Hydrolysis
A mixture of 1 mL stock solution and 1 mL of 1N NaOH was heated at 60°C for one hour. The solution was then neutralized using 1N HCl, diluted, filtered, and analysed. ¹⁹
Oxidative Degradation
To induce oxidative stress, 1 mL of stock solution was combined with 1 mL of 10% H₂O₂ and heated at 60°C for one hour. The sample was cooled, diluted, filtered, and injected into the system.
Thermal Degradation
The solid drug substance was placed in a petri dish and exposed to dry heat at 105°C for 3 hours. The degraded material was dissolved in diluent and analysed.
Photolytic Degradation
Solid samples were exposed to UV light in a photostability chamber for 3 hours. The treated material was then diluted with diluent and subjected to chromatographic analysis.
Reduction Degradation
For reduction stress, 1 mL of stock solution was mixed with 1 mL of 10% sodium bisulfite solution and heated at 60°C for one hour. After cooling, the sample was filtered and injected.
Hydrolytic Degradation
A mixture of 1 mL stock solution and 1 mL of HPLC-grade water was heated at 60°C for one hour. The resulting solution was filtered and analysed.20
Table 11: Forced Degradation results for Bempedoic acid and Ezetimibe
| Results: % Degradation results | Bempedoic acid | Ezetimibe | ||||||||
| Area | % Assay | % Deg | Purity Angle | Purity Threshold | Area | % Assay | % Deg | Purity Angle | Purity Threshold | |
| Control | 2229638 | 100 | 0 | 6.325 | 9.959 | 123091 | 100 | 0 | 5.128 | 16.295 |
| Acid | 2154889 | 96.6 | 3.4 | 6.318 | 9.947 | 112346 | 91.3 | 8.7 | 5.163 | 16.241 |
| Alkali | 1985423 | 89.0 | 11.0 | 6.359 | 9.921 | 118330 | 96.1 | 3.9 | 5.154 | 16.255 |
| Peroxide | 1941404 | 87.0 | 13.0 | 6.336 | 9.963 | 105584 | 85.8 | 14.2 | 5.102 | 16.239 |
| Reduction | 2142098 | 96.0 | 4.0 | 6.344 | 9.989 | 119437 | 97.0 | 3.0 | 5.187 | 16.203 |
| Thermal | 2038517 | 91.4 | 8.6 | 6.302 | 9.914 | 122589 | 99.6 | 0.4 | 5.149 | 16.257 |
| Photolytic | 2210212 | 99.1 | 0.9 | 6.369 | 9.932 | 119028 | 96.7 | 3.3 | 5.183 | 16.298 |
| Hydrolysis | 2213965 | 99.3 | 0.7 | 6.387 | 9.991 | 121410 | 98.6 | 1.4 | 5.106 | 16.243 |
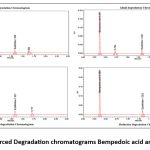 |
Figure 10: Forced Degradation chromatograms Bempedoic acid and Ezetimibe |
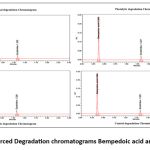 |
Figure 11: Forced Degradation chromatograms Bempedoic acid and Ezetimibe |
Discussion
The developed UPLC method demonstrated excellent system suitability with retention times of 0.365 min for Bempedoic acid (BA) and 1.326 min for Ezetimibe (Eze), theoretical plates exceeding 8000, a tailing factor below 1.2, and resolution greater than 9. Linearity was observed over the ranges of 45–270 µg/mL for BA (R² = 0.99989) and 2.5–15 µg/mL for Eze (R² = 0.99981). Precision studies showed %RSD values below 2% for system, method, and intermediate precision, while accuracy studies gave mean recoveries of 100.3% for BA and 99.9% for Eze, well within the acceptance range of 98–102%. The method proved robust to minor changes in chromatographic conditions, with all %RSD values remaining below 2%. Sensitivity was confirmed with LOD/LOQ values of 0.54/1.80 µg/mL for BA and 0.03/0.10 µg/mL for Eze. Forced degradation studies revealed that both drugs were relatively stable under hydrolytic and photolytic conditions, while moderate degradation occurred under acidic, basic, and oxidative stress. The highest degradation was observed for BA under alkaline conditions (11.0%) and for Eze under peroxide stress (14.2%). In all stress conditions, the purity angle values were less than the purity threshold, confirming the stability-indicating capability of the method. Overall, the results demonstrate that the proposed UPLC method is specific, precise, accurate, robust, and suitable for the stability evaluation and routine quality control of bempedoic acid and ezetimibe in fixed-dose formulations. 21,22
Moreover, our method achieved fast runtime (2.5 min), excellent resolution (9.45), and low LOD/LOQ values. Use of an isocratic mode, which simplifies the method compared to gradient-based HPLC methods. This makes the present UPLC method one of the most efficient, robust, and cost-effective analytical tools available for quality analysis of the BA–Eze combination in drug products. 23,24
Comparative literature table
| Column / System | Mobile Phase | Flow / λ | Retention (BEM/EZT) | Linearity & LOD/LOQ | Reference |
| Waters Acquity C18 UPLC, 50×2.1 mm, 1.7 µm | Methanol: ACN:Water (50:30:20), 0.5 mL/min | UV @ 260 nm | 1.83 min / 3.58 min | BEM: 30–130 µg/mL; EZT: 5–50 µg/mL; LOD ≈0.12 µg/mL, LOQ ≈0.36 µg/mL | 14 |
| X-Bridge Phenyl (150×4.6 mm, 3.5 µm) RP-UPLC | 0.1% formic acid/ACN (70:30), 1.0 mL/min | UV @ 230 nm | 1.16 min / 3.21 min | BEM: 27–337.5 µg/mL (R²=0.9991); EZT: 1.5–18.75 µg/mL (R²=0.9993); LOD/LOQ BEM: 0.27/2.7 µg/mL; EZT: 0.015/0.15 µg/mL | 15 |
| Waters C18 (150×4.6 mm, 3.5 µm) UPLC–MS/MS | 0.1% OPA/ACN (50:50), 1.0 mL/min | UV @ 230 nm; MS detection | BPA 2.457 EZM 3.888 | LOD BPA 0.225 µg/mL and EZM 0.013 µg/mL LOQ 0.743 µg/mL and 0.043 µg/mL | 16 |
| Phenyl XBD (100×2.1 mm, 1.7 µm) RP-UPLC | 0.1% TFA/H₂O–ACN, ambient | UV @ 230 nm | BPA 0.422 EZM 0.87 | LOD/LOQ approx. 0.225/0.743 µg/mL (BEM); 0.013/0.043 µg/mL (EZT) | 17 |
Conclusion
A sensitive and robust UPLC method was developed and validated for the simultaneous analysis of Ezetimibe (Eze) and Bempedoic acid (BA). The method proved to be robust, linear across a wide concentration range, specific, accurate, and precise. Stress degradation studies confirmed that the method meets ICH requirements for stability-indicating assays by effectively distinguishing the active drug substances from their degradation products. Therefore, this method can be reliably applied for stability testing and quality evaluation of fixed-dose combination formulations containing both drugs.
Acknowledgement
Authors express their sincere gratitude to Seven Hills College of Pharmacy, Tirupati, for providing all required facilities to accomplish the entitled work.
Funding Sources
The author(s) received no financial support for the research, authorship, and/or publication of this article.
Conflict of Interest
The authors do not have any conflict of interest.
Data Availability Statement
This statement does not apply to this article.
Ethics Statement
This research did not involve human participants, animal subjects, or any material that requires ethical approval.
Informed Consent Statement
This study did not involve human participants, and therefore, informed consent was not required.
Clinical Trial Registration
This research does not involve any clinical trials.
Permission to reproduce material from other sources
Not Applicable
Author Contributions
Madhu Reddemma: Conceptualization, Methodology.
Chandrasekar Raju: Writing – Original Draft.
Pratyusha Valligatla: Data Collection, Analysis.
Chandrasekar Raju: Writing – Review & Editing.
Sivagami Bojan: Visualization, Supervision.
Mounika Tummalapalli: Funding Acquisition.
Charumathi Salva: Resources, Supervision.
Sunil Kumar Ellampati: Project Administration.
References
- Biolo G, Vinci P, Mangogna A, et al. Mechanism of action and therapeutic use of bempedoic acid in atherosclerosis and metabolic syndrome. Front Cardiovasc Med. 2022 Oct 28; 9:1028355. doi: 10.3389/fcvm.2022.1028355.
CrossRef - Marazzi G, Caminiti G, Perrone MA, et al. Addition of Bempedoic Acid to Statin-Ezetimibe versus Statin Titration in Patients with High Cardiovascular Risk: A Single-Centre Prospective Study. J Cardiovasc Dev Dis. 2024 Sep 14;11(9):286. doi: 10.3390/jcdd11090286.
CrossRef - Pirillo A, Catapano AL. New insights into the role of bempedoic acid and ezetimibe in the treatment of hypercholesterolemia. Curr Opin Endocrinol Diabetes Obes. 2022 Apr 1;29(2):161-166. doi: 10.1097/MED.0000000000000706.
CrossRef - Kumar A, Saini G, Nair A, Sharma R. UPLC: a preeminent technique in pharmaceutical analysis. Acta Pol Pharm. 2012;69(3):371-80.
- Blessy M, Patel RD, Prajapati PN, Agrawal YK. Development of forced degradation and stability indicating studies of drugs—A review. J Pharm Anal. 2014;4(3):159–165. https://doi.org/10.1016/j.jpha.2013.09.003
CrossRef - Dube S, Ramesh M, Kumar KPS, Reddy YP. UPLC-MS/MS method for the quantification of Bempedoic acid in human plasma: Application to a pharmacokinetic study. Bioanalysis. 2019;11(18):1653–1662. https://doi.org/10.4155/bio-2019-0146
CrossRef - ICH Q1A(R2): Stability Testing of New Drug Substances and Products. International Conference on Harmonisation; 2003.
- ICH Q2(R1): International Conference on Harmonisation of Technical Requirements for Registration of Pharmaceuticals for Human Use. Validation of Analytical Procedures: Text and Methodology, 2005.
- Tiwari G, Tiwari R. Bioanalytical method validation: An updated review. Pharm Methods. 2010;1(1):25-38. doi: 10.4103/2229-4708.72226.
CrossRef - Suresh A, Balakrishnan A, Ramaswamy V, Natesan S. Analytical method development and validation for simultaneous estimation of Bempedoic acid and Ezetimibe in pure and its pharmaceutical dosage form by RP-HPLC. Biomed Chromatogr. 2024;38(9): e5938. doi: 10.1002/bmc.5938.
CrossRef - Kasa Maheshwari, Satla Shobha Rani. Validated method for the simultaneous estimation of bempedoic acid and ezetimibein bulk and tablet formulation by RP-HPLC method: World Journal of Pharmaceutical Sciences, 2022; 10(09): 33–41. https://doi.org/10.54037/WJPS.2022.100903.
- Karla, V.R., Raghasudha, M. and Chitta, R. Simultaneous Determination of Bempedoic Acid and Ezetimibe in Rat Plasma Using HPLC–PDA and Its Applications to a Pharmacokinetic Study. Chemistry Africa2022; 5, 917–927. https://doi.org/10.1007/s42250-022-00392-7
CrossRef - Prashanti Chitrapu, Avinish Chaudhary, Sagar Narendra Ande, et al. Simultaneous Estimation of Bempedoic Acid and Ezetimibe by HPLC Journal of Cardiovascular Disease Research. 2023; 14, (12): 358-367. DOI: https://doi.org/10.48047/
- Yarra, U.S.T., Gummadi, S. Stability indicating RP-UPLC method for simultaneous quantification of bempedoic acid and ezetimibe in bulk and pharmaceutical formulations. Futur J Pharm Sci.2021;7, 209. https://doi.org/10.1186/s43094-021-00363-8
CrossRef - Molleti D, Amgoth KP, Pallekona S. Stability Indicating Method Development and Validation for the Estimation of Bempedoic Acid and Ezetimibe by Reverse Phase–Ultra Performance Liquid Chromatography. J. Pharm. Sci. Drug Res. 2021;13(5):559-564. DOI: 10.25004/IJPSDR.2021.130514
CrossRef - Vejendla, A., Talari, S., Ramu, G. et al.Characterization of novel stress degradation products of Bempedoic acid and Ezetimibe using UPLC–MS/MS: development and validation of stability-indicating UPLC method. Futur J Pharm Sci. 2021; 7, 234. https://doi.org/10.1186/s43094-021-00381-6
CrossRef - Dandamudi S, Rangapuram V. Synchronized analysis of bempedoic acid and ezetimibe in pure binary mixture and their combined tablets by a new stability indicating RP-UPLC method. J. of Health Sci. 2022;6(S3):7278-90. doi:10.53730/ijhs. v6nS3.7743.
CrossRef - Talari S, Anuradha V, Rajani CH. Characterization of Novel Stress Degradation Products of Bempedoic Acid and Ezetimibe using UPLC-MS/MS: Development and Validation of Stability indicating UPLC Method. J Chem Eng Process Technol. 2021; 12: p38.
- Shruti Nilakh, Sonali Mahaparale, Shrutika Kambhale, Kanchan Chaudhari. Development and Validation of a RP-HPLC Method for Simultaneous Determination of Bempedoic Acid and Ezetimibe in Pharmaceutical Dosage Form. Journal of Chemical Health Risks. 2024, 14(3): 1548-1553.
CrossRef - Marwan A. Ibrahim Ayman M. Algohary, Manal A. Babaker, Ahmed M. Ibrahim Design of Experiment and green analytical chemistry principles for developing a robust and sustainable Stability-Indicating HPLC method for Bempedoic acid impurity profiling. Microchemical Journal, 2024, 207, https://doi.org/10.1016/j.microc.2024.112133
CrossRef - Amit Goel, Sanjula Baboota, Jasjeet K. Sahni, Kona S. Srinivas, Ravi S. Gupta, Abhishek Gupta, Vinod P. Semwal, Javed Ali, Development and Validation of Stability-Indicating Assay Method by UPLC for a Fixed Dose Combination of Atorvastatin and Ezetimibe, Journal of Chromatographic Science, Volume 51, Issue 3, March 2013, Pages 222–228, https://doi.org/10.1093/chromsci/bms131
CrossRef - Kumar SA, Debnath M, Rao JV, Sankar DG. New Validated Stability-Indicating Rp-HPLC Method for Simultaneous Estimation of Atorvastatin and Ezetimibe in Human Plasma by Using PDA Detector. Adv Pharm Bull. 2015 Sep;5(3):385-91. doi: 10.15171/apb.2015.053.
CrossRef - Kancherla, P., Velpuri, V., Alegete, P., Albaseer, S. S., Khagga, M., & Das, P. (2016). LC–MS/MS characterization of the forced degradation products of ezetemibe: Development and validation of a stability-indicating UPLC method. Journal of Taibah University for Science, 10(1), 148–160. https://doi.org/10.1016/j.jtusci.2015.08.001
CrossRef

This work is licensed under a Creative Commons Attribution 4.0 International License.


