

Manuscript accepted on : 08-09-2025
Published online on: 18-09-2025
Plagiarism Check: Yes
Reviewed by: Dr. Kamesh Viswanathan
Second Review by: Dr. Rakesh Shelke
Final Approval by: Dr. Eugene A. Silow
Pooja Dilip Ahire1*, Laxman Ashok Kawale1 and Vandana Shamrao Nade2
1Department of Pharmaceutical Chemistry, MVP Samaj’s College of Pharmacy, Nashik, Maharashtra, India
2Department of Pharmacology, MVP Samaj’s College of Pharmacy, Nashik, Maharashtra, India
Corresponding Author E-mail:ahirepooja01@gmail.com
ABSTRACT: A simple approach was developed for the rapid, selective and sensitive estimation of finerenone in spiked human plasma utilizing the high-performance liquid chromatography (HPLC) method. The protein precipitation technique was adopted for sample preparation, subsequently followed by separation and detection using the HPLC system. The quantification of finerenone in spiked human plasma was validated in compliance with regulatory guidelines (USFDA, EMEA and ICH). A mixture consisting of acetonitrile and water was utilized as the mobile phase. The separation was accomplished using a Phenomenex C18 column. The concentration range achieved was from 150 ng/ml to 6000 ng/ml. The accuracy obtained was 95 to 103% for calibration standards and 92 to 102 % for quality control (QC) samples. The precision was < 4% and recovery study showed 88% recovery. The stability study was conducted and the proposed method was determined to be stable. The application of one-way ANOVA revealed no significant variability in intra- and inter-day precision (p > 0.05), thereby confirming the consistency of the method. The method was effectively developed and validated, demonstrating simplicity, accuracy, rapidity, sensitivity and cost effectiveness.
KEYWORDS: Bioanalytical method; Finerenone; HPLC; Plasma; Validation
| Copy the following to cite this article: Ahire P. D, Kawale L. A, Nade V. S. Bioanalytical Method Development and Validation for Estimation of Finerenone in Spiked human plasma using RP-HPLC Technique and Application of Statistical Tool. Biotech Res Asia 2025;22(3). |
| Copy the following to cite this URL: Ahire P. D, Kawale L. A, Nade V. S. Bioanalytical Method Development and Validation for Estimation of Finerenone in Spiked human plasma using RP-HPLC Technique and Application of Statistical Tool. Biotech Res Asia 2025;22(3). Available from: https://bit.ly/420DTPU |
Introduction
Finerenone ((4S)-4-(4-Cyano-2-methoxyphenyl)-5-ethoxy-2,8-dimethyl-1,4-dihydro-1,6-naphthyridine-3-carboxamide), C21H22N4O3, having MW 378.432 g·mol−1.1,2 (Chemical structure shown in figure 1) is a non-steroidal mineralocorticoid receptor antagonist.3,4 Finerenone is prescribed to mitigate the risk of persistent reduction in glomerular filtration rate, end-stage renal disease, cardiovascular mortality, and hospitalization due to heart failure in individuals with chronic renal disease linked to type II diabetes mellitus.5,6
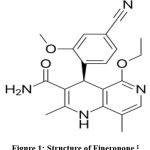 |
Figure 1 Structure of Fineronone1 |
Finerenone received FDA approval in July 2021, and subsequently, EMA approval in March 2022.7 Finerenone demonstrates greater potency compared to current medications within its class, particularly mineralocorticoid receptor (MR) antagonists.8 Development of bioanalytical method is a key component of the drug development process.9
A review of the literature indicates that various analytical approaches have been documented for the estimation of finerenone in bulk drug and dosage forms.10–12 However, there are limited bioanalytical methods reported,13 notably including the use of HPLC/MS which are time consuming, costly and requires extensive sample preparation to remove the interfering components.14 A fluorescent chemo sensor method has been established for the quantification of finerenone in human plasma, which entails several intricate stages, rendering the process costly.15 No technique has been reported yet for quantification of finerenone in spiked human plasma using RP-HPLC with UV detection.13 There is dire need to develop a selective, rapid, and sensitive bioanalytical method for the estimation of finerenone for its pharmacokinetic evaluation.1,16,17
Materials and Methods
Reagents used were analytical grade. Fineronone drug and Dapagliflozin (IS) were obtained with certificate of analysis. Acetonitrile, methanol, orthophosphoric acid, ammonium acetate were obtained from Qualigens (thermofisher scienctific). Water utilized in the study was HPLC grade and obtained from Moreshwar enterprises. Plasma samples were procured from Arpan blood bank, Nashik, Maharashtra.
Instrumentation: HPLC (Agilent, 1260 Infinity II) with Openlab EZchrome software was used for the study. UV spectrometer utilized was from Jasco 550 series with spectra manager software.
Optimised chromatographic conditions: Phenomenex C18 (250 mm X 4.6 mm i.d, 5μm) was selected for the study. The column oven temperature was kept 40° C. wavelength for detection obtained was 252 nm. Flow rate was kept as 1.00 ml/min. The Injection volume was 80 µl. Mobile phase selected was Acetonitrile (ACN): Water in 50:50 % v/v concentration.
Selection of Internal standard: Through multiple trials with various internal standards (IS), dapagliflozin was chosen as the IS due to its favourable chromatographic response along with finerenone (FIN) under the optimized chromatographic conditions outlined above. (R.T for FIN was 4.86 min, R.T for IS was 10.42 min). Figure 2 represents the chromatogram for finerenone and IS. Theoretical plates were 13284 and 16343 resp.
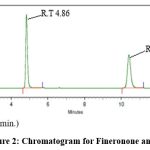 |
Figure 2: Chromatogram for Fineronone and IS |
Calibration standards and Quality control (QC) samples: A 500 µg/ml stock solution of finerenone (500 µg/ml) and dapagliflozin (IS) were made. Different stock solutions were made for QC samples and calibration standards. From the above stock solutions, working solutions were made in the range of 0.15µg/ml, 0.5 µg/ml ,1 µg/ml, 2 µg/ml, 3µg/ml, 4.5 µg/ml, 6 µg/ml (i.e 150ng/ml to 6000ng/ml) for calibration samples. The QC samples were prepared as Lower limit of quantitation (LLOQ) 0.15 µg/ml, lower quality control (LQC) 0.45 µg/ml, middle quality control (MQC) 3 µg/ml and higher quality control (HQC) 4.8 µg/ml.
Optimized extraction method: Protein precipitation provides numerous benefits in bioanalytical techniques, such as simplicity, rapidity, and cost-efficiency.18 475 µl plasma was combined with 25 µl of finerenone working solutions and vortexed for 1 minute. Subsequently, 50 µl of 75 µg/ml Dapagliflozin (IS) in a methanol solution was added and vortexed for an additional 1 minute. Added 20 µl of 2% formic acid and vortexed for 1 minute. Added 1 ml of acetonitrile and vortexed for 2 minutes. Centrifuged at 4000 RPM for 3 minutes. 0.5 ml of supernatant was collected and introduced in the HPLC system. Fig 3 represents the chromatogram for extracted sample of finerenone and IS in plasma.
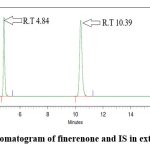 |
Figure 3: Chromatogram of finerenone and IS in extracted sample |
Assay validation: The bioanalytical approach was validated in compliance with regulatory standards such as United States Food and Drug Administration (USFDA), International Council for Harmonisation (ICH) and European Medicines Agency (EMEA). 19–21
The bioanalytical method validation was performed for the parameters like system suitability, selectivity, carry over, sensitivity, linearity, recovery, accuracy and precision, stability.22–26
System suitability: System suitability is a prerequisite of the Pharmacopoeia, utilized to determine if the chromatographic system is appropriate for the desired study.27 The tests were carried out by documenting the data collected from five replicate injections of the standard drug solution.
Selectivity: The FDA recommends that selectivity assessments should show no substantial response from interfering components at the R.T of the analyte or IS in blank samples.28 In accordance with regulatory guidelines, six plasma samples from distinct individuals were collected, including one haemolyzed and one lipemic plasma sample, and assessed for their response at R.T of finerenone and IS. The acceptance criteria specify that interfering components must not surpass 20% of the analyte response at LLOQ and must remain below 5% of the IS for each matrix.
Sensitivity: It is the lowest analyte concentration that can be measured with adequate accuracy and precision. Six replicates of LLOQ solution (0.15 µg/ml) were evaluated for accuracy and precision. The acceptance criterion for this study is that the %CV should not exceed 20%.
Carry over: This study involves determination of the presence of a test substance peak in control group or analytical check samples. In this study, duplicate blank samples were introduced following the ULOQ solution (i.e.6 µg/ml) throughout three runs. The conditions of acceptance for this study specify that the area at the R.T of Finerenone in blanks 2 and 3 must not exceed 20% of the area of the LLOQ.
Linearity: This allows for the evaluation of the concentration range within which the method operates reliably. Seven calibration standards were established within the range of 0.15 µg/ml to 6 µg/ml, and the results were recoded.
Accuracy and Precision: Accuracy and precision were ascertained through replicate analysis of the sample’s known composition. The criteria for accuracy require a bias value within 15% (20% for LLOQ), while precision is defined by a CV value of 15% or less (20% for LLOQ). For other QC samples (L, M, and HQC), a deviation of ± 15% (accuracy range of 85% to 115%) is permitted. The CV for LLOQ samples should not exceed 20% for precision, whereas for all other QC samples (LQC, MQC, and HQC) it should not exceed 15%.
Recovery: It measures the efficiency of an analytical process by comparing the amount of analyte extracted from a sample to the amount that was added to the sample. The determination involves comparing the analyte response in a biological sample that has been spiked and processed with the response in a processed biological blank sample that is subsequently spiked with the analyte. According to regulatory guidelines, the CV should not exceed 15.
Stability study: Stability of the optimised method was ascertained through Benchtop stability study or short-term stability study which ensures sample stability during sample processing conditions. Additionally, three freeze thaw cycles were also performed to check the sample’s stability. The processed sample was kept in autosampler for 24 h and checked for stability. The analyte samples were also subjected to stock solution stability study in which the stock solution for LQC and HQC were made and kept for 24 h and after 24 h LQC and HQC solutions were made in triplicate and checked for % accuracy. According to regulatory guidelines, the CV should not surpass 15.
Results
System suitability study
Five replicates of 3 ppm solution (Cmax) were injected and checked for parameters like asymmetry, theoretical plates and resolution and proposed method showed good chromatographic results. Table 1 elaborates the outcomes.
Table 1: System suitability study
| Parameter | Finerenone | Internal standard |
| R.T (min) | 4.86 | 10.42 |
| Asymmetry | 1.28 | 1.12 |
| Theoretical plates | 13284 | 16343 |
| Resolution | – | 22.61 |
Selectivity
Outcomes from six distinct human plasma lots were assessed, revealing no interference at the retention time of finerenone and the IS. Fig 4 represents a blank sample chromatogram from plasma lot 1 and fig 5 represents the chromatogram for LLOQ sample for plasma lot 1.
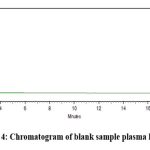 |
Figure 4: Chromatogram of blank sample plasma lot 1 |
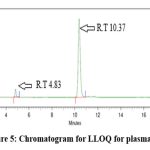 |
Figure 5: Chromatogram for LLOQ for plasma lot 1 |
Sensitivity
The CV obtained was 4.19% which falls within the acceptance criteria of regulatory guidelines. Table 2 summarizes the result of sensitivity study.
Table 2: sensitivity study
| LLOQ | Area of Finerenone in LLOQ |
| LLOQ 1 | 252410 |
| LLOQ 2 | 268593 |
| LLOQ 3 | 270531 |
| LLOQ 4 | 261429 |
| LLOQ 5 | 250128 |
| LLOQ 6 | 243521 |
| Mean | 257769 |
| STDV | 10803.07813 |
| % CV | 4.19 |
Carryover study
The carryover in the double blank following the ULOQ estimation over three runs for finerenone and the internal standard was determined to be 0% of the mean area of the LLOQ. The acceptance criteria were met. Outcomes are given in table 3.
Table 3: Carry over study
| Particulars | Area | % Interference |
| Blank 1 | 0 | 0 |
| ULOQ | 7401278 | NA |
| Blank 2 | 0 | 0 |
| Blank 3 | 0 | 0 |
| Mean area of Fineronone at LLOQ | 257769 | NA |
Linearity
The calibration curve for finerenone was plotted for concentration vs area ration of finerenone to IS. The curve found linear in the range from 0.15 µg/ml to 6 µg/ml with linearity equation as 0.3404 ϰ + 0.00543 and regression coefficient 0.999. The LLOQ of finerenone obtained was 0.15 µg/ml (150 ng/ml). The optimised method showed good linearity meeting all standard specifications. Fig 6 shows the calibration curve for finerenone.
Fig 6 Calibration curve for finerenone
Accuracy and Precision
Table 4 and 5 provides the data for accuracy and precision study. The accuracy for calibration standards was observed between 95 to 103% and 93 to 103 % for QC samples. While the % CV obtained for intraday and interday precision was not more than 6%. The accuracy and precision were determined by the acceptability criteria of accuracy, which is 85 to 115% (20% variation for LLOQ solution), and precision, which is a maximum of 15% CV. (20% for LLOQ).
Table 4: Summary of Accuracy study for calibration standards
| Actual concentration in
µg/ml |
Recovered concentration in µg/ml | % Accuracy |
| 0.15 | 0.143 | 95.33 |
| 0.50 | 0.492 | 98.40 |
| 1.00 | 0.959 | 95.90 |
| 2.00 | 2.053 | 102.65 |
| 3.00 | 3.05 | 101.67 |
| 4.50 | 4.454 | 98.98 |
| 6.00 | 6.075 | 101.25 |
Table 5: Summary of Accuracy and Precision study for QC samples
| Level | Actual concentration
µg/ml |
Recovered concentration µg/ml | % Accuracy
|
% CV |
| REPEATABILITY BATCH | ||||
| LLOQ | 0.15 | 0.142 | 95.11 | 3.59 |
| LQC | 0.45 | 0.446 | 99.11 | 4.00 |
| MQC | 3.00 | 2.906 | 96.87 | 3.40 |
| HQC | 4.80 | 4.806 | 100.15 | 2.48 |
| INTRADAY PRECISION | ||||
| LLOQ | 0.15 | 0.152 | 101.56 | 4.27 |
| LQC | 0.45 | 0.445 | 99.04 | 5.60 |
| MQC | 3.00 | 2.997 | 99.92 | 3.53 |
| HQC | 4.80 | 4.814 | 100.31 | 5.46 |
| INTERDAY PRECISION | ||||
| LLOQ | 0.15 | 0.144 | 96.22 | 5.32 |
| LQC | 0.45 | 0.454 | 101.07 | 5.22 |
| MQC | 3.00 | 2.96 | 98.75 | 4.63 |
| HQC | 4.80 | 4.863 | 101.31 | 3.21 |
Recovery study
The efficacy of the finerenone extraction method was assessed, and the results are presented in Table 6. The overall recovery of finerenone and IS was observed to be 88.29 % and 86.69 % respectively giving % CV value of 2.50 and 1.28 for finerenone and IS respectively. The results are ascertained with regulatory acceptance criteria for CV should not more than 15.
Table 6: Recovery study
| Level | % Recovery | Overall Recovery (%) | Overall % CV |
| FINERENONE | |||
| LQC | 90.84 |
88.29 |
2.50 |
| MQC | 87.00 | ||
| HQC | 87.03 | ||
| INTERNAL STANDARD | |||
| LQC | 87.13 |
86.69 |
1.28 |
| MQC | 85.43 | ||
| HQC | 87.52 | ||
Stability study
During the storage, experimental processing, and analysis of the sample, the stability of the analyte was confirmed through various stability studies. The stability study was conducted in triplicates of LQC and HQC samples as per regulatory guidelines.19 The data for stability study is presented in table 7. The samples were subjected for different stability parameters like short term stability, freeze thaw stability, autosampler stability, Processed extracted sample stability at room temperature and stock solution stability as per regulatory guidelines. The outcomes from these stability studies are computed in table 7 and it was observed that the method was
Table 7: Stability study
| Parameter | Accuracy (%) | % CV |
| Short term stability | 98.21 | 4.50 |
| Freeze thaw stability | 96.15 | 5.76 |
| Autosampler stability | 98.34 | 6.10 |
| Processed extracted sample at room temperature | 96.00 | 3.11 |
| Stock solution stability | 96.55 | 3.04 |
ANOVA test
In bioanalytical method validation, precision serves as a crucial parameter for evaluating the method’s performance. Both intraday and interday precision were evaluated using %CV at all QC levels (LLOQ, LQC, MQC and HQC) and the outcomes falls within acceptance criteria. Additionally, one way ANOVA test was applied to intraday and interday precision for statistical confirmation. Table 8 summarizes the outcomes for ANOVA test indicating the P value 0.0688, 0.8353 and 0.2235 for repeatability, intraday and interday precision respectively. The ANOVA test revealed no statistically significant difference among group means (as p value > 0.05). Also, the % CV was obtained was not more than 15% which falls within regulatory criteria. These findings confirm the reproducibility, reliability and consistency of the method. Outcomes from ANOVA test are computed in table 8.
Table 8: Outcomes of ANOVA analysis
| Source of variation | SS | df | MS | F | P-value | F crit |
| REPEATABILITY BATCH | ||||||
| Between groups | 91.883 | 3 | 30.627 | 2.761 | 0.0688 | 3.098 |
| Within groups | 221.816 | 20 | 11.090 | |||
| Total | 313.699 | 23 | ||||
| INTRDAY PRECISION | ||||||
| Between Groups | 19.6764333 | 3 | 6.55881111 | 0.28545718 | 0.835307 | 3.098391 |
| Within Groups | 459.5303 | 20 | 22.976515 | |||
| Total |
479.206733 |
23 | ||||
| INTERDAY PRECISION | ||||||
| Between Groups | 101.83535 | 3 | 33.9451167 | 1.58822486 | 0.223575 | 3.098391 |
| Within Groups | 427.459833 | 20 | 21.3729917 | |||
| Total | 529.295183 | 23 | ||||
Discussion
The finerenone validation procedure in spiked human plasma samples was successfully constructed with reference to the provisions of USFDA, ICH and EMA. Despite the fact that finerenone is commonly analysed using LC–MS/MS methods that report retention times around 2 minutes,1 while effective for mass spectrometry, this early elution overlaps with plasma matrix peaks in HPLC with UV detection, making such methods unsuitable for UV detection.29 In contrast the proposed method is developed for quantification of finerenone, with chromatographic conditions optimized specifically to achieve appropriate retention and resolution from plasma matrix. Furthermore, the existing methods utilizing LC-MS/MS and fluorescent techniques for finerenone determination involve complex and time-consuming stages, particularly during sample preparation and instrument operation.15,30 However, the proposed HPLC method employs simple instrumentation, simpler operational steps from sample preparation to detection, making the overall process less time-consuming and more practical for routine analysis. Hence, the proposed method is simple, inexpensive and suitable even in the continuous bioanalysis. The ease of use, and the high levels of validation, promotes its use in those laboratories that cannot afford the use of mass spectrometers. In current study protein precipitation technique was adopted for sample preparation that is economical and minimizes losses of the extracted drug in the sample during the process and enhances sensitivity, speed and accuracy of the method.31 The developed method had an excellent response in the linearity range of 150 ng/ml to 6000 ng/ml with a correlation coefficient of 0.999 that is sufficient to reliably quantify finerenone in the biological matrix, which in turn makes it suitable to pharmacokinetic studies. The precision of the methodology was determined at calibration mediums and quality controls (LLOQ, LQC, MQC and HQC). The accuracy was found to be in the range of values 92-103% falling within the guidelines given by FDA, ICH and EMA. Additionally, ANOVA test was applied to asses the statistical confirmation of precision and method was determined to be reliable and consistent.
Conclusion
The analytical technique newly suggested is a milestone in the measurement of finerenone in spiked human plasma with the high-performance liquid chromatography employing ultraviolet detection. Sensitivity and linearity of the suggested protocol are of superior level, which is a decisive attribute in the stable measurement of finerenone. The method was systematically validated thoroughly and fulfilled all the regulatory standards (USFDA, ICH, EMA). The method showed excellent system suitability, sensitivity with LLOQ of 150 ng/ml. It was highly selective with no interference from six different plasma samples along with one haemolyzed and one lipemic plasma. The method showed good linear response in concentration range of 150 ng/ml to 6000 ng/ml. Accuracy was observed between 92-103%. Precision study showed %CV within 6% for both intraday and interday precision. The mean recovery was observed to be 88% indicating high extraction efficiency. The stability study under different conditions, namely short term, freeze thaw, autosampler, stock solution and processed sample stability showed % CV not exceeding 6%. Such data proves to be very reliable and reproducible making it suitable for pharmacokinetic analysis, testing bio equivalents as well as carrying out therapeutic drug monitoring. The results of such investigation not only contribute to quality control and quality assurance in the area of pharmaceutical development but also offer feasible solution in the quantification of finerenone in other biological fluids.
Acknowledgement
Authors are grateful to Principal and Management of MVP Samaj’s College of Pharmacy, Nashik for their support.
Funding Sources
The author(s) received no financial support for the research, authorship, and/or publication of this article.
Conflict of Interest
The authors do not have any conflict of interest.
Data Availability Statement
This statement does not apply to this article.
Ethics Statement
This research did not involve human participants, animal subjects, or any material that requires ethical approval.
Informed Consent Statement
This study did not involve human participants, and therefore, informed consent was not required.
Clinical Trial Registration
This research does not involve any clinical trials.
Permission to reproduce material from other sources
Not Applicable
Author Contributions
Pooja Ahire: Conceptualization, planning, data gathering, experimental work, Writing-Review and editing.
Laxman Kawale Conceptualization, planning, data analysis, project supervision, Draft review
Vandana Nade: Conceptualization, supervision, draft review
References
- Rohde G, Loewen S, Heinig R. Determination of finerenone – a novel, selective, nonsteroidal mineralocorticoid receptor antagonist – in human plasma by high-performance liquid chromatography-tandem mass spectrometry and its application to a pharmacokinetic study in venous and capillary human plasma. J Chromatogr B Analyt Technol Biomed Life Sci. 2021;1172. doi:10.1016/j.jchromb.2021.122643
CrossRef - Memon AAQ, Iqbal S. Finerenone, a Novel and Safer Approach toward Management of Diabetic Kidney Disease with Heart Failure. Global Journal of Medical, Pharmaceutical, and Biomedical Update. 2022;17:12. doi:10.25259/gjmpbu_25_2022
CrossRef - Pradhan A, Tripathi UC. Finerenone: a breakthrough mineralocorticoid receptor antagonist for heart failure, diabetes and chronic kidney disease. Egyptian Heart Journal. 2024;76(1). doi:10.1186/s43044-024-00586-z
CrossRef - Memon AAQ, Iqbal S. Finerenone, a Novel and Safer Approach toward Management of Diabetic Kidney Disease with Heart Failure. Global Journal of Medical, Pharmaceutical, and Biomedical Update. 2022;17:12. doi:10.25259/gjmpbu_25_2022
CrossRef - PARMAR I, PATEL YA. RECENT METHOD DEVELOPMENT BY ANALYTICAL TECHNIQUES OF NEW FDA APPROVED RUGS IN 2021. Int J Curr Pharm Res. Published online May 15, 2022:17-21. doi:10.22159/ijcpr.2022v14i3.1975
CrossRef - Kolkhof P, Jaisser F, Kim SY, Filippatos G, Nowack C, Pitt B. Steroidal and novel non-steroidal mineralocorticoid receptor antagonists in heart failure and cardiorenal diseases: Comparison at bench and bedside. In: Handbook of Experimental Pharmacology. Vol 243. Springer New York LLC; 2017:271-305. doi:10.1007/164_2016_76
CrossRef - Bayer’s KERENDIA® (finerenone) Receives U.S. FDA Approval for Treatment of Patients with Chronic Kidney Disease Associated with Type 2 Diabetes.
- Ashjian E, Clarke M, Pogue K. Pharmacotherapy considerations with finerenone in the treatment of chronic kidney disease associated with type 2 diabetes. American Journal of Health-System Pharmacy. 2023;80(23):1708-1721. doi:10.1093/ajhp/zxad192
CrossRef - Moein MM, El Beqqali A, Abdel-Rehim M. Bioanalytical method development and validation: Critical concepts and strategies. J Chromatogr B Analyt Technol Biomed Life Sci. 2017;1043:3-11. doi:10.1016/j.jchromb.2016.09.028
CrossRef - Chepyala S, Medidi S, Malik JK. Development of a Robust and Reliable RP-HPLC Method for the Estimation of Finerenone in Tablet Dosage Form. International Journal of Drug Delivery Technology. 2024;14(2):703-708. doi:10.25258/ijddt.14.2.15
CrossRef - Mohammed A, Arsalan M, Jabeen M, Begum H. Liquid Chromatography Method Development and Validation for the Quantitative Determination of FINERENONE in Bulk Drug and Pharmaceutical Formulation. Published online 2023. https://www.researchgate.net/publication/372890228
- Somase K, Rishipathak D. Finerenone API Estimation Using RP-HPLC Technique and LC-MS Characterization of its Degradation Products. Oriental Journal Of Chemistry. 2025;41(2):528-540. doi:10.13005/ojc/410222
CrossRef - PARMAR I, PATEL YA. RECENT METHOD DEVELOPMENT BY ANALYTICAL TECHNIQUES OF NEW FDA APPROVED RUGS IN 2021. Int J Curr Pharm Res. Published online May 15, 2022:17-21. doi:10.22159/ijcpr.2022v14i3.1975
CrossRef - Lakshmi Kalyani B, Yesvanti S, Sahasrika S, Likhitha Reddy M, Roshini B. COMPREHENSIVE INSIGHTS INTO FINERENONE: RECENT HPLC ADVANCEMENTS AND CLINICAL PROSPECTS Depatment of pharmaceutical analysis. International Journal of Research and Analytical Reviews. 2023;10(4). doi:10.21203/rs.3.rs-2984018/vl
- Alsharif ST, Alaqel S l., Almalki AH, et al. A fluorescence chemo sensor approach for determination of finerenone in pharmaceutical formulation and human plasma: Method development and validation. Spectrochim Acta A Mol Biomol Spectrosc. 2024;309:123836. doi:10.1016/J.SAA.2024.123836
CrossRef - Lentini S, Heinig R, Kimmeskamp-Kirschbaum N, Wensing G. Pharmacokinetics, safety and tolerability of the novel, selective mineralocorticoid receptor antagonist finerenone – results from first-in-man and relative bioavailability studies. Fundam Clin Pharmacol. 2016;30(2):172-184. doi:10.1111/fcp.12170
CrossRef - Gerisch M, Heinig R, Engelen A, et al. Biotransformation of finerenone, a novel nonsteroidal mineralocorticoid receptor antagonist, in dogs, rats, and humans, in vivo and in vitro. Drug Metabolism and Disposition. 2018;46(11):1546-1555. doi:10.1124/dmd.118.083337
CrossRef - Nováková L, Vlčková H. A review of current trends and advances in modern bio-analytical methods: Chromatography and sample preparation. Anal Chim Acta. 2009;656(1-2):8-35. doi:10.1016/j.aca.2009.10.004
CrossRef - Fda, Cder. Bioanalytical Method Validation Guidance for Industry Biopharmaceutics Bioanalytical Method Validation Guidance for Industry Biopharmaceutics Contains Nonbinding Recommendations.; 2018.http://www.fda.gov/Drugs/GuidanceCompliance RegulatoryInformation/ Guidances/ default.htmand/ orhttp://www.fda.gov/ AnimalVeterinary/ GuidanceCompliance Enforcement/GuidanceforIndustry/default.htm
- INTERNATIONAL COUNCIL FOR HARMONISATION OF TECHNICAL REQUIREMENTS FOR PHARMACEUTICALS FOR HUMAN USE ICH HARMONISED GUIDELINE BIOANALYTICAL METHOD VALIDATION AND STUDY SAMPLE ANALYSIS M10.
- Medicines Agency E. 2** Committee for Medicinal Products for Human Use (CHMP) Guideline on Bioanalytical Method Validation.; 1922. www.ema.europa.eu/contact
- Sabale V, Jiwankar M, Sabale P. Bioanalytical method development, validation and quantification of flutamide in spiked rat plasma by using high-performance liquid chromatography. Futur J Pharm Sci. 2023;9(1). doi:10.1186/s43094-023-00528-7
CrossRef - Illendula S, Samiha SK, Bheema Naik A, Suresh C V, V Rao KN. World Journal of Pharmaceutical and Life Science DEVELOPMENT AND VALIDATION OF A NEW ANALYTICAL RP-HPLC METHOD FOR THE ESTIMATION OF FINERENONE IN BULK AND MARKETED FORMULATION. Vol 10.; 2024. www.wjpls.org
CrossRef - Heinig R, Gerisch M, Engelen A, Nagelschmitz J, Loewen S. Pharmacokinetics of the Novel, Selective, Non-steroidal Mineralocorticoid Receptor Antagonist Finerenone in Healthy Volunteers: Results from an Absolute Bioavailability Study and Drug–Drug Interaction Studies In Vitro and In Vivo. Eur J Drug Metab Pharmacokinet. 2018;43(6):715-727. doi:10.1007/s13318-018-0483-9
CrossRef - Mohammed A, Arsalan M, Jabeen M, Begum H. Liquid Chromatography Method Development and Validation for the Quantitative Determination of FINERENONE in Bulk Drug and Pharmaceutical Formulation. Published online 2023. https://www.researchgate.net/publication/372890228
CrossRef - Gerisch M, Heinig R, Engelen A, et al. Biotransformation of finerenone, a novel nonsteroidal mineralocorticoid receptor antagonist, in dogs, rats, and humans, in vivo and in vitro. Drug Metabolism and Disposition. 2018;46(11):1546-1555. doi:10.1124/dmd.118.083337
CrossRef - Briscoe CJ, Stiles MR, Hage DS. System suitability in bioanalytical LC/MS/MS. J Pharm Biomed Anal. 2007;44(2):484-491. doi:10.1016/j.jpba.2007.03.003
CrossRef - Tiwari G, Tiwari R. Bioanalytical method validation: An updated review. Pharm Methods. 2010;1(1):25. doi:10.4103/2229-4708.72226
CrossRef - matrix effect.
- Seger C. Usage and limitations of liquid chromatography-tandem mass spectrometry (LC-MS/MS) in clinical routine laboratories. Wiener Medizinische Wochenschrift. 2012;162(21-22):499-504. doi:10.1007/s10354-012-0147-3
CrossRef - Afroz F, Moni F, Sharmin S, et al. Efficacy of Liquid-Liquid Extraction and Protein Precipitation Methods in Serum Sample Preparation for Quantification of Fexofenadine in Human Serum. Acta Pharmaceutica Sciencia. 2022;60(3):273-293. doi:10.23893/1307-2080.APS.6018
CrossRef
Abbreviations List
HPLC: High-performance liquid chromatography
MW: Molecular weight
i.d: internal diameter
RPM: Revolution per minute
IS: Internal standard
R.T: Retention time
RP: Reverse phase
QC: Quality control
LLOQ: Lower limit of quantitation
LQC: Lower quality control
MQC: Medium quality control
HQC: Higher quality control
ULOQ: Upper limit of quantitation
RSD Relative standard deviation
CV: coefficient of variation
USFDA: United States Food and Drug Administration
ICH: International Council for Harmonization
EMEA: European Medicines Agency

This work is licensed under a Creative Commons Attribution 4.0 International License.


