

Manuscript accepted on : 29-05-2025
Published online on: 10-06-2025
Plagiarism Check: Yes
Reviewed by: Dr. Vivek Anand
Second Review by: Dr. Soumita Dutta
Final Approval by: Dr. Eugene A. Silow
Bijayananda Sahoo, Shubham Pradhan, Satyabrata Dash and Biswajit Rath*
Department of Biotechnology, Maharaja Sriram Chandra Bhanja Deo University, Baripada, Odisha, India.
Corresponding Author E-mail: brath_2000@yahoo.com
DOI : http://dx.doi.org/10.13005/bbra/3383

ABSTRACT: The present investigation was carried out to understand the phytochemical composition, catalase activity, and H₂O₂ radical scavenging efficiency in Parmotrema tinctorum across zones of Similipal Biosphere Reserve (transition, buffer, and core). Phytochemicals include phenolic, flavonoid, tannin, and terpenoid contents varied across zones, with the transition zone showing the highest phenolic content (319.95 ± 9.2 µg/g GAE). Catalase activity was highest in the core zone (10.44 ± 0.41 U/g), decreasing progressively towards the buffer zone. H₂O₂ radical scavenging assays established an increase in extraction efficiency with higher methanol concentrations, with the transition zone displaying the highest efficiency, peaking at 76.84 ± 1.48% at 500 µL. The transition zone also showed the significant IC₅₀ (245.52 µg/mL), indicating superior antioxidant potential compared to the buffer and core zones. These findings suggest that environmental factors influence secondary metabolite distribution and catalase activity, with distinct metabolic adaptations in each zone. The concentration-dependent scavenging activity in the transition zone highlights it as the most active region, contributing valuable insights into the ecological and adaptive physiology of P. tinctorum. These differences suggest adaptive metabolic responses across zones, influenced by environmental factors, enhancing the lichen resilience and ecological function.
KEYWORDS: Catalase activity; Ecological zone; FTIR; GCMS; Lichen metabolites; Variation
Download this article as:| Copy the following to cite this article: Sahoo B, Pradhan S, Dash S. Rath B. A Comparative Study of Antioxidative Properties of the Lichen Parmotrema Tinctorum Distributed in Different Regions of Similipal Biosphere Reserve, Odisha, India. Biotech Res Asia 2025;22(2). |
| Copy the following to cite this URL: Sahoo B, Pradhan S, Dash S. Rath B. A Comparative Study of Antioxidative Properties of the Lichen Parmotrema Tinctorum Distributed in Different Regions of Similipal Biosphere Reserve, Odisha, India. Biotech Res Asia 2025;22(2). Available from: https://bit.ly/3TgkyoZ |
Introduction
Lichens are resilient organisms that adapt to a wide range of environments, with their populations influenced by factors like humidity, temperature, air quality, and nutrient levels. 1 They also serve as effective bioindicators for air quality, climate change, and biodiversity assessments, offering a cost-efficient alternative to ambient monitoring devices.2 Lichens can thrive in diverse habitats from intertidal zones to mountain peaks and across arctic, desert, and tropical regions.3 Their diversity and distribution are shaped by various geographical factors, including latitude, altitude, environmental conditions, and microhabitat characteristics.4 Additionally, as epiphytes, lichens benefit from the diversity of tree and shrub species, which provide specific bark chemistry, texture, and stability conducive to their growth.5 The Similipal Biosphere Reserve (SBR), located in Odisha, India, has been selected as the study area due to its crucial role in India’s biodiversity, spanning 2,750 square kms. The reserve is divided into three main zones: the ‘core zone,’ which covers 1,194.75 square kms and is designated as a Biosphere reserve, and the ‘buffer zone,’ which spans 1,555.25 square kms. Changes in species richness with elevation characterize the vegetation in a clear and compelling way. SBR contains a variety of dry and moist deciduous vegetation, including forests, grasslands, streams, rivers, mountains, valleys, and undulating terrain with endemic and significant flora and fauna, including lichens. The varied altitude and topographical features, such as the core zone of 1,194.75 km² (461.30 sq mi), contribute to the reserve’s biodiversity. With an average elevation of approximately 900 meters (3,000 ft), the reserve includes prominent peaks like Khairiburu, reaching 1,178 meters (3,865 ft), and Meghasani at 1,158 meters (3,799 ft). Climatic conditions, including annual rainfall between 1,200 mm and 2,000 mm and summer temperatures ranging from 38 ºC in July to 23 ºC in February, along with climatic strategies, support lichen succession and diverse distribution patterns. These geographical and climatic factors provide ideal conditions for lichen growth, enabling their widespread distribution on various hosts, such as plants, rocks, and soil. The present study investigates the lichen Parmotrema tinctorum across three major zones: transition, buffer, and core. This comparative evaluation examines phytochemicals, antioxidant properties, and catalase activity within the species, aiming to clarify how changes in elevation influence physiological parameters and metabolite production. The study explores factors that most significantly regulate the intensity of secondary metabolite production within the species across different elevations.
Material and Methods
Study site
Similipal Biosphere Reserve (SBR), positioned in 21028’-22008’ N and 86004’-86037’ E in Mayurbhanj, State Odisha, India (Fig.1), has quite distributed dry and moist deciduous vegetation comprising forest, grassland, streams, rivers, mountains, valleys, and sites of undulation with endemic and significant flora and fauna, including lichens. The collection of lichens is carried out seasonally following the random sampling technique from different transition, buffer and core zones of the Similipal Biosphere Reserve. Documentation from the field was done using a method of random sampling, and many field trips were conducted. Samples were assembled, placed in polythene bags, wrapped in white bags, and transported to the research laboratory.
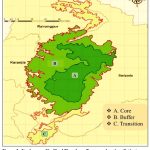 |
Figure 1: Study area: Similipal Biosphere Reserve showing distinct core, buffer and transition zones |
Sample collection and identification
Parmotrema tinctorum collected from Core zone (Jenabil, Barehipani), Buffer zone (Tulasibani, Utras) and Transition zone (Sitakund, Lulung) within Similipal Biosphere Reserve, Odisha (Fig.1) and all samples are preserved in the laboratory for experimental purpose and identified using lichen identification manuals based on their morphology and molecular approaches.6
Preparation of Lichen Extracts
The lichen material that had dried was well bleached and deepen in 5% acetone for washing debride materials and using a sterilized mortar and pestle, it was cursed to a uniform powder. After that, 100 mg of dried powdered lichen material was saturated in 10 ml of methanol, shaking overnight, for 72 hours at room temperature and filtered using a Whatman no-1 filter paper for further analysis.
Genomic DNA isolation and PCR analysis in lichen
A lichen sample (10 mg, from the upper mycelial zone) was placed in liquid nitrogen while enclosed in a micro-vial containing three or four, 2.5 mm sterile glass beads. This procedure followed the method of Park et al.7 and at 4°C, the pure DNA was kept for further analysis. The genomic DNA was then subjected to PCR analysis for rDNA to confirm molecular identification. For PCR analysis for SSU, ITS 1&2 for P. tinctorum (PTITS-1 & PTITS-2) were amplified using appropriately designed primers. The 5.8S rDNA (PRITS1–5.8S–PRITS2) were amplified using the following forward and reverse primers: PTITS1: 5′-AATCTCACCTTTAGCATTGTTTC-3′ (GC: 34.8%, Tm: 51.5°C, ΔG: -39.85 kcal/mol) and PTITS2: 5′-CGCTTATTGATATGCTTAAGTTC-3′ (GC: 34.8%, Tm: 49.9°C, ΔG: -40.11 kcal/mol). This process followed the approach of White et al.8 .To confirm the presence and size of the amplicons, the PCR bands were observed on a 1.5% agarose gel run at 120 V for 25 minutes. The products were then purified using recombinant shrimp alkaline phosphatase and exonuclease I. Sequence reads were edited and put together using MEGA and Sequencer v.5 software. The system-generated sequences were further analysed using Basic Local Alignment Search Tool (BLAST) (http://www.ncbi.nlm.nih.gov), and sequences with 97% similarity were considered for submission to NCBI and accession numbers were obtained.
Estimation of total Phytochemicals
Phenol
The Folin-Ciocalteu reagent method was used to calculate the total phenolic content (%).9 Two milliliters of 2% sodium carbonate was mixed with 100 microliters of lichen extract, 500 μl of Folin’s reagent was added ten minutes later. At 650 nm, absorbance was measured and quantified in relation to the Gallic acid equivalent (GAE).
Flavonoid
The total flavonoid content was estimated based on the method described by Zhishen et al.10. The lichen extract was reacted with 500 µl of sodium nitrite, followed by the addition of 300 µl of 10% aluminium chloride and 1 ml of sodium hydroxide. After the reaction mixture was incubated, absorbance was measured at 510 nm. Results were expressed as micrograms of quercetin equivalent per gram of dry extract.
Tannin
The amount of tannins in total was calculated using a modified method by Oyaizu.11 Lichen extract (1ml, 1:1 mg/ml) were prepared. After adding sodium carbonate solution and the Folin Phenol reagent, the volume was adjusted to 10 mL using distilled water. After incubation and measurement at 725 nm, tannin content was expressed as Tannic Acid Equivalent (TAE).
Terpenoid
Terpenoid content was quantified using Ghorai et al.12. 1 ml of lichen extract (1:1 mg/ml) was mixed with 1 ml of chloroform and 1 ml of concentrated H2SO4, and absorbance was measured at 538nm, and quantify against tannic acid equivalent.
Assessment of Enzymatic antioxidant assay
Preparation of cell extract
To prepare 1 g of lichen extract for the catalase (CAT) activity assay, the sample was homogenized in a chilled mixture containing 50 mM ethylene diamine tetra acetic acid (EDTA), 50 mM sodium phosphate buffer (pH 7.4), 10% (w/v) polyvinyl pyrrolidone (PVP), and 2 mM phenyl methyl sulfonyl fluoride (PMSF). The homogenization was performed in a frozen state using a pestle under dark conditions. The resulting viscous mixture was centrifuged at 14,000 rpm for 20 minutes at 4 °C using a high-speed refrigerated centrifuge. The supernatant obtained after centrifugation was used for the determination of catalase activity.
Catalase (CAT) activities
Following the Aebi method, the catalase activity of two examined lichens is evaluated13. The final volume of the catalase analysis preparative chemical combination was 3 ml, which included 2 ml of 0.1M potassium phosphate buffer (pH 6.8), 500 μl of an enzyme extract, and 500 μl of H2O2. The rate of H2O2 consumption was used to evaluate the catalase activity at 240 nm over a 3-min period in comparison to the blank.
Assessment of Non enzymatic antioxidant assay
H2O2 Assay
Hydrogen peroxide (H₂O₂) scavenging activity was evaluated using a spectrophotometric method based on the protocol described by Ruch et al.14. A solution of H₂O₂ was prepared in phosphate buffer (1 M, pH 7.4), and 0.6 ml of this solution was mixed with varying concentrations of the lichen extract (ranging from 100 to 500 μg/ml). After a 10-minute incubation, absorbance was measured at 230 nm. Ascorbic acid served as the reference standard for comparison. The percentage of radical scavenging activity was calculated using the formula: % Scavenging = [(Absorbance of control – Absorbance of sample) / Absorbance of control] × 100.
Preparation of the lichen extracts for Characterisation of Biomolecules
Lichen samples were dried and grounded into a powder, from which 10 g of the material was extracted using an organic solvent (methanol) on a Soxhlet apparatus (Borosil) at 45 °C for 24 hours. In order to acquire dry extract up to 2 g for further analysis, the solvent was evaporated using a hot air oven set at 42–45 °C after 6–8 heat cycles of extraction.
Gas chromatography mass spectrometry analysis (GC–MS)
GC–MS studies were carried out on an Elite-wax Capillary-column chromatography (60.0 m × 250 μm × 0.25 μm). A 10:1 split ratio was chosen to inject 1.5μl of the sample using the auto sampler. 60°C as the starting temperature for one minute. The temperature was programmed to 200°C and held for three minutes. It was then tuned to 10-300°C and kept for ten minutes. The injection port’s temperature could be adjusted to 280°C, and 1.0 ml/min of helium was used as a carrier gas. The source temperature was 150°C and the transferred temperature was 160°C after a 7-minute solvent delay. From the GC peak regions, the extract composition percentage was calculated. A qualitative analysis that allowed for the detection was performed using Pub-Chem, Chem-Spider, Spectra Base, and the NIST standard spectral library.
Fourier transform infrared spectroscopy (FT‑IR)
Thermo Nicolet iS10 FT-IR spectrometer (Thermo Scientific, USA), equipped with a Smart iTR attenuated total reflectance (ATR) module, was utilized to obtain the infrared spectra. The methanolic extract of the lichen, prepared using a Soxhlet apparatus and dried to a fine powder, was firmly pressed onto the instrument’s horizontal ATR crystal. Each measurement involved 32 scans against the background, with data recorded at a resolution of 4.0 cm⁻¹ across the spectral range of 4000 to 400 cm⁻¹. The device was configured with threshold values of 96.393 (S1), 96.131 (S2), and 97.775 (S3), and operated at a sensitivity setting of 50. Before each measurement cycle, reference spectra were collected using a thoroughly cleaned blank crystal. The resulting spectral data were processed using Essential FT-IR and GraphPad Prism software (version 8.0.1), with all analyses conducted in triplicate.
Statistical analysis
To perform the statistical analysis, Prism and Microsoft excel were used. The significance of antioxidant activity was evaluated using the Student’s t-test. Results are presented as the mean ± standard deviation (SD) from three replicates.
Results
Morphological Identification
Thallus: Corticolous in habitat, with an upper surface that ranges from whitish-gray to ivory. Isidia are laminal, displaying an irregular distribution across the thallus surface. They are cylindrical in shape, varying from simple to sparsely branched forms. Lobes are relatively broad, often exhibiting brown to black coloration at the tips. Margins are eciliate. The thallus lacks rhizines near the margins (erhizinate), but towards the center, it turns blackish and becomes sparsely rhizinate. Rhizines are stout, short, predominantly simple, black, occasionally sparsely branched, and frequently found in clusters. The medulla is white. Apothecia are not seen.
Molecular Identification
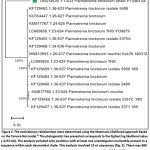 |
Figure 2: The evolutionary relationships were determined using the Maximum Likelihood approach based on the Tamura-Nei model.¹⁵ The phylogenetic tree presented corresponds to the highest log likelihood value (-2157.04). |
Phytochemicals
This study evaluated the secondary metabolite content of Parmotrema tinctorum which occur across different zones (transition, buffer, and core) using methanol extract. The study indicated variations in phenolic, flavonoid, tannin, and terpenoid contents. In the transition zone, phenolic content was the highest, measuring 319.95 ± 9.2 µg/g GAE, while flavonoid, tannin, and terpenoid levels were 124.19 ± 4.6 µg/g QE, 134.04 ± 8.3 µg/g TAE, and 332.2 ± 2.3 µg/g LE, respectively. In the buffer zone, phenolic content slightly decreased to 311.55 ± 97µg/g GAE, with notable reductions in flavonoid (87.39 ± 9.8µg/g QE) and tannin (115.28 ± 1.5µg/g TAE) contents. However, terpenoid content increased to 370.3± 6.53 µg/g LE in this zone. In the core zone, the lowest phenolic (215.55 ± 0.97 µg/g GAE), flavonoid (76.55 ± 7.6 µg/g QE), and tannin (93.32 ± 4.4 µg/g TAE) values were observed, while terpenoid content measured 334.7 ± 4.5 µg/g LE (Table 1). These results indicate a gradient of phytochemical constituents within the lichen, suggesting possible metabolic adaptations in response to environmental factors specific to each zone.
Table 1: Estimation of total phytochemicals of P. tinctorum in different zones i.e., transition, buffer and core zone
| Lichens | Zones of SBR | Solvent | Phenol(µg/g GAE) | Flavonoid (µg/g QE) | Tannin(µg/g TAE) | Terpenoid(µg/g LE) |
| P. tinctorum | Transition | Methanol | 319.95 ± 9. 2 | 124.19± 4.6 | 134.04±8.3 | 332.2±2.3 |
| Buffer | 311.55 ± 97 | 87.39 ± 9. 8 | 115.28±1.5 | 370.3±6.53 | ||
| Core | 215.55±0. 97 | 76.55 ± 7.6 | 93.32±4.4 | 334.7± 4.5 |
Here, GAE- Gallic acid equivalent, QE- Quercetine equivalent, TAE- Tannic acid equivalent and LE- Linalool equivalent
Catalase activity
The catalase activity of Parmotrema tinctorum was measured throughout several zones of SBR (transition, buffer, and core), and the results showed a considerable difference in catalase activity based on the zone inside the lichen. Catalase activity was highest in the core zone (10.44 ± 0.41 U/Gram), while the transition zone showed moderate activity (4.29 ± 0.106 U/Gram). In contrast, the buffer zone had the lowest catalase activity (2.2 ± 0.424 U/gram). These findings point to a gradient in catalase activity from the outermost buffer zone to the innermost core, which could reflect various physiological responses within the lichen, either due to environmental stressors or metabolic demands specific to each zone (Fig. 3).
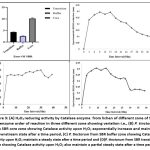 |
Figure 3: (A) H2O2 reducing activity by Catalase enzyme from lichen of different zone of SBR, the enzyme order of reaction in three different zone showing variation i.e., |
H2O2 radical scavenging assay
The methanol extraction efficiency of P. tinctorum was assessed across three zones (core, buffer, and transition) at increasing concentrations (100–500 µL). The results revealed a positive trend of increasing extraction efficiency with higher concentrations in each zone. At 100 µL, the core, buffer, and transition zones showed extraction values of 16.805 ± 0.595%, 13.255 ± 1.175%, and 33.685 ± 0.855%, respectively. Increasing the concentration to 200 µL resulted in a marked increase in the buffer and transition zones, with extraction efficiencies reaching 53.175 ± 0.295% and 46.025 ± 0.705%, while the core zone increased to 29.76 ± 0.56%. At 300 µL extract concentration in the core, buffer, and transition zones was recorded at 36.8 ± 0.75%, 29.92 ± 0.61%, and 54.5 ± 0.82%, respectively. Higher concentrations of 400 µL and 500 µL led to peak extraction efficiencies, with values reaching 59.72 ± 0.4% in the core, 65.33 ± 2.1% in the buffer, and 76.84 ± 1.48% in the transition zone at 500 µL (Fig. 4). Across all concentrations, the transition zone consistently showed the highest extraction values, indicating its increased responsiveness to methanol concentration. The IC₅₀ values further illustrated the differential activity across zones, with its half maximal concentration (IC₅₀) recorded in the transition zone i.e., 245.52 µg/ml, compared to 360.95 µg/ml in the buffer zone and 413.43 µg/ml in the core zone. These findings highlight the concentration-dependent extraction efficiency of methanol in P. tinctorum, with the transition zone demonstrating both the significant H2O2 scavenging and IC₅₀, suggesting it is the most active region under the tested conditions.
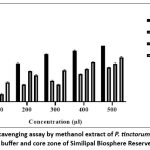 |
Figure 4: H2O2 Scavenging assay by methanol extract of P. tinctorum from transition, buffer and core zone of Similipal Biosphere Reserve |
GC–MS analysis and compound characterization
GC-MS screening is used to identify different viable metabolites in methanol extracts of lichens (Fig. 5).The retention periods of certain compounds were compared to the spectrum information gleaned from the respective compounds’ NIST library. The GC-MS screening of P. tincotorum illustrated Phenols, Benzyl Alcohols, Anisoles, Phenyl acetates, Thiophenes, Protein kinase, Ketone groups, Triazolopyridazines, Dialkylarylamines (Table 2).
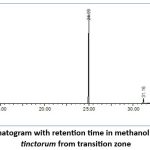 |
Figure 5: GC-MS Chromatogram with retention time in methanol extract of Parmotrema tinctorum from transition zone. |
Table 2: Characterization of metabolites through GC-MS analysis in Parmotrema tinctorum
| Chemical | Group | Retention Time | % of area | Retention Index |
| 1,4-BENZENEDIOL, 2-METHYL- (C7H8O2) | Phenols | 24.991 | 66.188 | 1223 |
| 1,3-BENZENEDIOL, 2-METHYL- (C7H8O2) | Phenols | 24.991 | 66.188 | 1223 |
| ORCINOL (C7H8O2) | Phenols | 24.991 | 66.188 | 1378.1 |
| BENZENEMETHANOL, 3-HYDROXY- (C7H8O2) | Benzyl Alcohols | 24.991 | 66.188 | 2257 |
| 1,2-BENZENEDIOL, 4-METHYL- (C7H8O2) | Phenols | 24.991 | 66.188 | 1293 |
| 1,2-BENZENEDIOL, 3-METHYL- (C7H8O2) | Phenols (Catechol) | 24.991 | 66.188 | 1263 |
| 1-ETHYLAMINO-3-(2-METHOXY-4-METHYL-PHENOXY)-PROPAN-2-OL (C13H21NO3) | Anisoles | 23.785 | 0.086 | – |
| SILANE, DIMETHYLPHENOXY(1,1,2-TRIMETHYLPROPYL)- (C14H24OSi) | – | 29.187 | – | – |
| BENZOIC ACID, 2,4-DIHYDROXY-6-METHYL-, METHYL ESTER (C9H10O4) | Phenols | 31.163 | 4.250 | 1684.6 |
| BENZENEACETIC ACID, 2,5-DIHYDROXY- (C8H8O4) | Phenyl acetates | 31.163 | 4.250 | – |
| ETHYL 2,4-DIHYDROXY-6-METHYLBENZOATE (C10H12O4) | Phenol(benzoate ester) | 31.163 | 4.250 | 1758.7 |
| METHYL 2,6-DIHYDROXY-4-METHYLBENZOATE (C9H10O4) | Phenols | 31.163 | 4.250 | 1474 |
| BENZENEACETIC ACID, 2,5-DIHYDROXY- (C8H8O4) | Phenyl acetates | 31.163 | 4.250 | – |
| BENZOIC ACID, 2,4-DIHYDROXY-6-METHYL-/ β-Resorcylic acid (C8H8O4) | Phenols | 31.163 | 4.250 | 1745 |
| BENZO[B]THIOPHENE-2-OL (C8H6OS) | – | 31.163 | 4.250 | – |
| PROPYL 2,4-DIHYDROXY-6-METHYLBENZOATE (C11H14O4) | – | 31.163 | 4.250 | 1786.2 |
| METHYL 4-METHOXYSALICYLATE (C9H10O4) | – | 31.163 | 4.250 | 1439 |
| 4-HYDROXYBENZO[B]THIOPHENE (C8H6OS) | Thiophenes | 31.163 | 4.250 | – |
| IMIDAZO[4,5-D]PYRIDAZIN-4-ONE, 7-METHYL-1,5-DIHYDRO- (C6H6N4O) | Protein Kinase | 31.163 | 4.250 | – |
| BENZALDEHYDE, 4-ETHOXY- (C9H10O2) | Phenol(aromatic ether) | 31.163 | 4.250 | 1308 |
| 1-(5-METHYL-2-PYRAZINYL)-1-PROPANONE (C8H10N2O) | Aryl alkyl ketones | 31.163 | 4.250 | – |
| METHYL 4-METHOXYSALICYLATE (C9H10O4) | – | 31.163 | 4.250 | 1439 |
| [1,2,4] TRIAZOLO [1,5-B] PYRIDAZIN-6-OL, 8-METHYL- (C6H6N4O) | Triazolopyridazines | 31.163 | 4.250 | – |
| METHYL 4-METHOXYSALICYLATE (C9H10O4) | – | 31.163 | 4.250 | 1426 |
| PHENOL,3-(DIETHYLAMINO)- (C10H15NO) | Dialkylarylamines | 31.163 | 4.250 | – |
FT-IR analysis
FTIR was used to identify the functional groups of pure isolate chemicals that were separated from the methanol fraction. There are multiple wave number zones in the spectrum that display a typical absorption band. Infrared (IR) spectrum of P. tinctorum, illustrated νAlcohols (O-H) and Amines (N-H) (3552 cm−1) νAlkanes (C-H) and aldehyde (C-H stretch), (2926-2852 cm−1), νAlkynes (≡C-H stretch) (2168 cm−1), aromatic compounds (C-H stretch), Alcohols (O-H stretch) and Amides (N-H stretch) (2926-3352 cm−1), νAlkynes (C≡C), νAlkenes (C=C stretch) and Aromatic compounds (C=C stretch) (1648 cm−1), νNitro compound (NO2 stretch) (1565 cm−1), νAlkyl and Aryls (C-F stretch) (1048-1458 cm−1), νAlkenes (≡C-H bend) (918 cm−1) (Fig. 6).
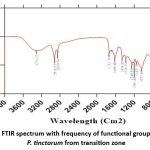 |
Figure 6: FTIR spectrum with frequency of functional group range of P. tinctorum from transition zone. |
Discussion
Spatial ecological magnitude is important for understanding secondary metabolite production and function within the lichen thallus. Secondary compound production varies among individuals within a single species’ geographic range; such as concentrations of usnic acid fluctuate dramatically in arctic populations of Flavocetraria nivalis.17Chemotypes, or chemical variations within species, have been found to correlate geographically in various lichens.18 In some lichen species, compound synthesis is not uniform across the thallus but seems concentrated in specific intermediate medullary zones.19 The cortex is known to produce a variety of compounds that are absent in medullary hyphae, with specific roles assigned to compounds prevalent in certain tissues.20 The present study infers the variation in phytochemical content, more specifically phenols, flavonoids, tannins, and terpenes in Parmotrema tinctorum across different altitudinal zones within the SBR, encompassing the transition, buffer, and core regions. Quantitative analyses revealed relative differences in phytochemical levels among these zones, suggesting that altitude and environmental conditions influence phytochemical accumulation in this lichen species. The findings also indicated the effect of elevation gradients on secondary metabolite concentrations, which may have implications for ecological adaptation and potential medicinal applications of Parmotrema tinctorum. In agreement with recent findings Culberson and Culberson reported that Cladonia uncialis produces squamatic acid when grown in coastal North America but lacks this compound in continental populations.21 Additionally, Culberson observed that few other lichen groups show similar habitat-based chemical variation, as seen in the Cladonia chlorophaea and Parmelia bolliana.22 These variants are morphologically indistinguishable, but their phytochemical variations differentiate them, with distribution patterns gradually shifting across hemispheres. Given the impact of environment and geography on secondary compound production, this provides an essential database for identifying optimal habitats, gaining adaptability, and recognizing phenotypically variable forms within species.
Anaerobic S. cerevisiae cells have been demonstrated to lack catalases, which are activated by oxygen.23 Glycolysis appears to be the primary energy source under aerobic circumstances, requiring less catalase23. Additionally, it is conceivable that the presence of its hydrogen peroxide substrate, or catalase substrate, H₂O₂, which is created by a number of processes in living things, controls catalase levels.24 In the present study, the H2O2 assay within species Parmotrema tinctorum from different elevation zones showed the transition zone had maximum scavenging activity. But in the catalase enzymatic assay, by using H₂O₂ as a substrate, there was a reversible outcome that the catalase activity in its several forms was functional in the high-elevation core zone of SBR. The phytochemical contain as well as secondary metabolite production are rich in transition followed by buffer zone, So, the phytochemicals, like lichen secondary metabolites, i.e., polyphenols, flavonoids, and terpenes, have maximum synthesis in the transition zone, followed by the buffer and core elevation zone. However, the O2 saturation remains lower in high elevation to maintain the O2 saturation in high altitude; point the catalase activity maximizes and protects cells from oxidative stress. Therefore, the secondary metabolite production and enzymatic behaviour alter along with the alteration of climatic, altitude, and geographic regions.
Conclusion
This study highlights the spatial and altitudinal variation in secondary metabolite production and catalase activity in the lichen Parmotrema tinctorum across different zones within the SBR. Phytochemical analyses revealed that concentrations of compounds such as phenols, flavonoids, tannins, and terpenes were highest in the transition zone, followed by the buffer and core zones, suggesting an altitude-dependent accumulation which may be possibly influenced by environmental factors. Enzymatic assays indicated that catalase activity varied inversely with phytochemical content across altitudinal gradients, with maximum catalase functionality observed in the high-elevation core zone, where oxygen levels are lower. These findings underscore the adaptive role of phytochemicals in oxidative stress management and suggest that secondary metabolites may support ecological resilience in varied habitats. This study indicated a valuable insight on differential phytochemical and antioxidant activity variations in lichens at different latitude affected by environmental gradients drive with implications for understanding their ecological adaptations and potential medicinal uses.
Acknowledgement
The authors gratefully acknowledge the Head of the Department of Biotechnology at Maharaja Sriram Chandra Bhanja Deo University for providing the necessary infrastructure. Special thanks go to the Principal Chief Conservator of Forests (PCCF) and Chief Wildlife Warden of Odisha (6725/4WL-288/2022, Bhubaneswar) for granting permission to collect samples from various forest localities within the Similipal Biosphere Reserve, Odisha.
Funding Source
The research work is financially supported by the Science and Technology Department, Govt. of Odisha [Grant No.-ST-BT-MISC-0008-2020-245/ST, Bhubaneswar].
Conflict of Interest
The authors do not have any conflict of interest.
Data Availability Statement
This statement does not apply to this article.
Ethics Statement
This research did not involve human participants, animal subjects, or any material that requires ethical approval.
Informed Consent Statement
This study did not involve human participants, and therefore, informed consent was not required.
Clinical Trial Registration
This research does not involve any clinical trials.
Permission to reproduce material from other sources
Not Applicable.
Author Contributions
Bijayananda Sahoo: Conceptualization, Methodology, Writing – Original Draft.
Shubham Pradhan: Data Collection, Analysis, Writing – Review & Editing.
Satyabrata Dash: Data Collection, Analysis, Writing – Review & Editing.
Biswajit Rath: Visualization, Supervision
References
- Geiser LH, Root H, Smith RJ, et al. Lichen-based critical loads for deposition of nitrogen and sulfur in US forests. Environmental Pollution. 2021; 291:118187. https://doi.org/10.1016/ j.envpol
CrossRef - Kularatne KI, De Freitas CR. Epiphytic lichens as biomonitors of airborne heavy metal pollution. Environmental and experimental botany. 2013; 88:24-32. https://doi.org/1016/j.envexpbot. 2012.02.010
CrossRef - Seaward MR. Lichens and sulphur dioxide air pollution: field studies. Environmental Reviews. 1993; 1(2):73-91. https://doi.org/10.1139/a93-007
CrossRef - Abas A, Din L. The diversity of lichens along elevational gradients in the tropical montane forest of Selangor, Malaysia. Sains Malays. 2021; 50(4):1199-209.http:// doi.org/ 10.17576/jsm-2021-5005-01
CrossRef - Grytnes JA, Heegaard E, Ihlen PG. Species richness of vascular plants, bryophytes, and lichens along an altitudinal gradient in western Norway. Acta oecologica. 2006; 29(3): 241-6.https://doi.org/ 10.1016/j.actao.2005.10.007.
CrossRef - Awasthi DD. Lichenology in Indian Subcontinent: A Supplement to” A Hand Book of Lichens”. Bishen Singh Mahendra Pal Singh; 2000.
- Park SY, Jang SH, Oh SO, Kim JA, Hur JS, et al. An easy, rapid, and cost-effective method for DNA extraction from various lichen taxa and specimens suitable for analysis of fungal and algal strains. 2014; 42(4):311-6. https:// doi.org/10.5941/ MYCO.2014. 42.4.311.
CrossRef - White TJ, Bruns T, Lee SJ, Taylor J et al. Amplification and direct sequencing of fungal ribosomal RNA genes for phylogenetics. PCR protocols: a guide to methods and applications. 1990; 18(1):315-22.
CrossRef - Taga MS, Miller EE, Pratt DE, et al. Chia seeds as a source of natural lipid antioxidants. Journal of the American oil chemists’ society. 1984; 61:928-31. https://doi.org /10.1007/BF02542169.
CrossRef - Zhishen J, Mengcheng T, Jianming W, et al.The determination of flavonoid contents in mulberry and their scavenging effects on superoxide radicals. Food chemistry. 1999; 64(4):555-9.https://doi.org/10.1016/S0308-8146 (98)00102-2.
CrossRef - Oyaizu M. Studies on products of browning reaction antioxidative activities of products of browning reaction prepared from glucosamine. The Japanese journal of nutrition and dietetics. 1986; 44(6):307 15.https://doi.org/ 10.5264/eiyogak uzashi.44.307.
CrossRef - Ghorai N, Chakraborty S, Gucchait S, Saha SK, Biswas S, et al. Estimation of total Terpenoids concentration in plant tissues using a monoterpene, Linalool as standard reagent.2012. https://doi.org/10.1038/protex.2012.055.
CrossRef - Aebi H. Catalase in vitro. Methods Enzymol. 1984; 105:121–126.
CrossRef - Ruch RJ, Cheng SJ, Klaunig JE, et al. Prevention of cytotoxicity and inhibition of intercellular communication by antioxidant catechins isolated from Chinese green tea. Carcinogenesis. 1989; 10(6):1003-8.https://doi.org/10.1093/carcin/10.6.1003.
CrossRef - Tamura K, Nei M. Estimation of the number of nucleotide substitutions in the control region of mitochondrial DNA in humans and chimpanzees. Molecular biology and evolution. 1993; 10(3):512-26.https://doi.org/10.1093/oxfordjournals.molbev.a04 0023.
- Tamura K, Stecher G, Kumar S, et al. MEGA11: molecular evolutionary genetics analysis version 11. Molecular biology and evolution. 2021; 38(7):3022-7.https://doi.org/10.1093/molbev/ msab120.
CrossRef - Bjerke JW, Joly D, Nilsen L, Brossard T, et al. Spatial trends in usnic acid concentrations of the lichen Flavocetraria nivalis along local climatic gradients in the Arctic (Kongsfjorden, Svalbard). Polar Biology. 2004:409-17. https://doi.org/ 10.1007/ s00300-004-0590-8.
CrossRef - Culberson CF, Culberson WL, Johnson A, et al. The Ramalina americana complex (Ascomycotina, Ramalinaceae): chemical and geographic correlations. 1990;167-86.https://doi.org/ 10.2307/3243621.
CrossRef - Liao C, Piercey-Normore MD, Sorensen JL, Gough K, et al. In situ imaging of usnic acid in selected Cladonia spp. by vibrational spectroscopy. Analyst. 2010; 135(12):3242-8.https://doi.org/10.1039/ C0AN00533A.
CrossRef
- Elix JA, Stocker-Wörgötter E. Biochemistry and secondary metabolites. Lichen biology. 2008;104-33.https://doi.org/10.1017/cbo9780511790478.008.
CrossRef - Culberson WL, Culberson CF. Habitat selection by chemically differentiated races of lichens. Science. 1967; 158(3805):1195-7.https://doi.org/10.1126/science.158.3805. 1195.
CrossRef - Culberson WL. Chemosystematics and ecology of lichen-forming fungi. Annual Review of Ecology and Systematics. 1970; 153-70.https://www.jstor.org/stable/ 2096769.
CrossRef - Ruis H. The biosynthesis of catalase. Canadian Journal of Biochemistry. 1979; 57(9):1122-30. https://doi.org/10.1139/o79-144.
CrossRef - Hogg JF, editor. The nature and function of peroxisomes (microbodies, glyoxysomes). New York: New York Academy of Sciences; 1969.

This work is licensed under a Creative Commons Attribution 4.0 International License.


