

Manuscript accepted on : 24 Apr 2025
Published online on: 16-06-2025
Plagiarism Check: Yes
Reviewed by: Dr. Supriya Mhamane
Second Review by: Dr. Bhavesh H. Patel
Final Approval by: Eugene A. Silow
Parimal Katolkar, Anuja Shrikhande*, Shubham Amadare
, Mithali Palandurkar and Swati Vidhate
Department of Pharmaceutical Chemistry, Kamla Nehru College of Pharmacy, Rastrasant Tukadoji Maharaj Nagpur University, Butibori, Nagpur, Maharashtra, India
Corresponding Author E-mail:anuja282001@gmail.com
DOI : http://dx.doi.org/10.13005/bbra/3385

ABSTRACT: The primary goal of this work was to create and test a stability-indicating reverse-phase high-performance liquid chromatography (RP-HPLC) method for the simultaneous detection of telmisartan (TEL) and benidipine hydrochloride (BEN) in bulk and pharmaceutical dose form. Using reverse phase chromatography, the developed method is simple, appropriate, and more efficient, stable, and reproducible. The C18 column, measuring 250 x 4.6 mm and packed with 5.0 μm particles, was used to separate TEL and BEN. When used as a mobile phase, various solvent solutions were evaluated and improved. TEL (100 μg/ml) and BEN (10 μg/ml) were used for their good peak forms and resolution in Methanol: Ammonium Dihydrogen Orthophosphate Buffer, pH 3.5 (80:20 v/v). The mobile phase was flowing at 1.0 ml/min, and both analytes were detected at 237 nm using UV/ Vis detectors. The method's development and validation were based on linearity, accuracy, precision, robustness, specificity, linearity, detection limit, and quantitation limit. TEL and BEN were found to be linear at doses of 5-15 and 50-150 μg/ml. According to this study, the impact of RP-HPLC techniques included a reduction of sample quality and standardization. The fact that the percentage relative standard deviation was less than 2% proved the exceptional precision of the proposed procedure.
KEYWORDS: Benidipine; Reverse-phase-high performance liquid chromatography; Stability indicating method; Telmisartan
Download this article as:| Copy the following to cite this article: Katolkar P, Shrikhande A, Amadare S, Palandurkar M, Vidhate S. Development and Validation of Stability Indicating RP-HPLC Method for Simultaneous Estimation of Benidipine and Telmisartan. Biotech Res Asia 2025;22(2). |
| Copy the following to cite this URL: Katolkar P, Shrikhande A, Amadare S, Palandurkar M, Vidhate S. Development and Validation of Stability Indicating RP-HPLC Method for Simultaneous Estimation of Benidipine and Telmisartan. Biotech Res Asia 2025;22(2). Available from: https://bit.ly/3HH1sG5 |
Introduction
Benidipine hydrochloride is a long-acting dihydropyridine Ca++ channel blocker with the chemical formula 3-[(3R)-1-(phenylmethyl)piperidin-3-yl]. 2,6-dimethyl -4-(3-nitrophenyl)-1,4-dihydropyridine 3,5-dicarboxylate hydrochloride. (figure1).1,2,3 Benidipine hydrochloride (BEN) is an orally active, highly potent, long-acting dihydropyridine (DHP) calcium channel blocker (L, N, and T-type) that inhibits a wide range of in vitro and in vivo activities. Hypertension is treated with a calcium channel blocker made up of only one enantiomer of dihydropyridine. Its anti-obesity abilities have also been confirmed. It inhibits not only L-type calcium channels but also T-type channels. 4,5
Telmisartan (TEL)’s chemical name is 2-[4-[[4-methyl-6-(1-methylbenzimidazol-2-yl)-2 propylbenzimidazol-1-yl]].(figure 2). The synthetic counterpart of angiotensin II receptor blockers, -methyl]phenyl]benzoic acid, is used to treat hypertension. TEL has a dissolution rate-limited absorption pattern in both humans and animals, despite being a poorly water-soluble medicine. As a result, it can be used as a model pharmaceutical to investigate how various physicochemical, physiological, and dose form aspects influence the absorption kinetics and bioavailability of hydrophobic medicines.6-11
Hypertension is treated with both medication combinations that include benidipine and telmisartan. One of the few strategies on stability uncovered by a literature study was the creation and validation of an RP-HPLC method for the simultaneous assessment of Benidipine and Telmisartan.
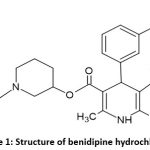 |
Figure 1: Structure of benidipine hydrochloride Click here to view Figure |
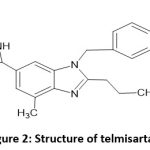 |
Figure 2: Structure of telmisartanClick here to view Figure |
Materials and Methods
Instrumentation
The medications were analyzed using the HPLC Shimadzu LC 20 AD, Column Phenomenex Luna C18 (250 mm x 4.6 mm, particle size 5 μ), Acme pump, UV/vis detector, and LC Solution software.
Chemicals and reagents
The TEL standard was provided by Mylan Laboratories Limited in Telangana, India, while the BEN standard was obtained from Pure chem PVT. LTD. Benitowa®TM (Akumentis Healthcare) tablets were purchased at a local pharmacy in Ankleshwar, Gujarat, India. Benidipine (10 mg) and TEL (100 mg) were used.
Preparation of standard solution of binary mixtures of TEL (100 μg/ml) and BEN (10 μg/ml)
To make the stock solution, 10 mg BEN and 100.2 mg TEL were properly weighed and dissolved in the diluent, then the volume was increased by the same amount to achieve the 100 ml limit.
Method Validation 12-13
Linearity
Pipette 1.0, 1.5, 2.0, 2.5, and 3.0 ml of TEL and BEN stock solution into 20 ml volumetric flask to achieve 50, 75, 100, 125, and 150 μg/ml and 5, 7.5, 10.0, 12.5, and 15 μg/ml for TEL and BEN, respectively. This investigation was conducted to determine the linearity of TEL and BEN.
Precision
Results should be reported as relative standard deviation (RSD) or coefficient of variance. Six injections of TEL (100 μg/ml) and BEN (10 μg/ml) into a repeatability standard solution were used to measure peak areas and percent RSD. TEL and BEN were tested again on the same day using an intraday precision standard solution, and the% RSD was discovered. The ultimate inter-day precision was obtained by analyzing a standard solution made up of TEL and BEN twice over numerous days and computing the % RSD.
Accuracy
The diluent was mixed with precisely weighed volumes of 10 mg BEN and 100.2 mg TEL until the volume reached 100 ml. Pipette 2 mL of the same solution into a 20 mL volumetric flask and dilute it with diluent.
It was diluted with diluent in a 100 mL volumetric flask after being spiked with 80, 100, and 120% of the reference solution. After pipetteing 2 mL of the same solution into a 20 mL volumetric flask, diluent was added. At 237 nm, the area of each solution peak was determined. The TEL, BEN, and percentage recoveries were computed at each level.
Limit of detection (LOD) and limit of quantitation (LOQ)
The LOD was computed using the same three calibration curves that were used to determine linearity. The LOD formula is LOD=3.3(SD/Slope), where SD represents the average of the three calibration curves’ Y-intercepts. Slope represents the average slope of the three calibration curves. The LOQ was computed using the same three calibration curves used to demonstrate linearity. The limit of quantification is calculated as follows: LOQ = 10(SD/Slope), where SD is the sum of the three calibration curves’ Y-intercepts.
Robustness
The effects of modifying each of the following factors individually on the system’s fitness for standard preparation were noted.
Change in flow rate (0.9ml/min and 1.1ml/min).
Change in wavelength (235 nm and 239 nm)
Buffer pH (3.35 & 3.65)
Forced degradation studies
Acid degradation
Transfer 10 ml of stock solution to a 100 ml volumetric flask, then add 10 ml of 0.1 N HCl solution and reflux for 30 minutes on a heating mantle at 60°C. It was derived from an acidic solution. After cooling, add 0.1 N NaOH solution drop by drop and shake to neutralize. Dilute to 100 ml with diluent and filter through 0.45 μm membrane filter for analysis.
Base Degradation
Transfer 10 ml of stock solution to a 100 ml volumetric flask, then add 10 ml of 0.1 N NaOH solution and reflux for 30 minutes on a heating mantle at 60°C. It was made using a simple solution. After cooling, add 0.1 N HCL solution drop by drop and shake regularly to ensure neutralization. Dilute to 100 ml with diluent and filter with 0.45 μm membrane filter before analysis.
Oxidative/ Peroxide Degradation
Transfer 10 ml of stock solution to a 100 ml volumetric flask, then add 10 ml of 0.3% H2O2 solution and reflux for 12 hours on the heating mantle at 60°C. After cooling, the volume was increased to 100 mL and filtered through a 0.45 μm membrane filter for analysis.
Thermal degradation
The pure medication was cooked in a 60°C oven for approximately 1 hour before being allowed to cool to room temperature. The above-mentioned medicine was correctly weighed to 9.9 mg BEN and 100.6 mg TEL and dissolved in 100 ml of diluent (mobile phase) (stock solution).
To acquire 10 μg/ml, pipette 2 ml of a standard stock solution of medication, dilute with 20 ml diluent, filter with a 0.45 μm membrane filter, and sonicate for 10 minutes before injecting the solution into the chromatography.
Photolytic degradation
Pure BEN and TEL medicines were placed in petri plates and subjected to UV light at 254 nm in a UV chamber for one hour. 9.9 mg BEN and 100.6 mg TEL were precisely weighed and dissolved in diluent (mobile phase) to meet the 100 ml mark (stock solution).
To obtain 10 μg/ml of solution, pipette 2 ml from a standard stock solution of the medication and dilute it with 20 ml of diluent.
Results
Selection of wavelength
A UV-visible spectrophotometer was used to scan standard solutions of TEL (100 μg/ml) and BEN (10 μg/ml) from 200 to 400 nm. Both solutions were scanned from 200 to 400 nm. The wavelength was determined using the overlay spectra of the aforementioned solutions. As seen in Fig. 3, TEL and BEN both exhibit a substantial response at 237 nm.
Chromatographic separation
Standard TEL and BEN solutions were introduced into the column via a 20 μl micro syringe. The chromatogram was run for the required number of minutes with a methanol mobile phase and an ammonium dihydrogen orthophosphate (pH 3.5) buffer solution (80:20 v/v). The detection took place at 237 nm. After the separation was completed, the chromatogram was turned off. Figure 4 shows the program used to record the peak’s size, height, retention duration, and resolution.
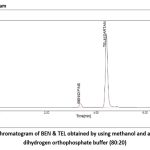 |
Figure 3: Chromatogram of BEN & TEL obtained by using methanol and ammonium dihydrogen orthophosphate buffer (80:20).Click here to view Figure |
Chromatographic Conditions:
Column : Hypersil BDS, C18, (250×4.6mm) 5μm
Flow Rate : 1.0 ml/min
Injection Volume : 20 μL
Wavelength : 237 nm
Column Temp. : Ambient
Run Time : 10 min
Specificity
The BEN and TEL blank’s chromatogram does not interfere with the chromatogram of the BEN and TEL standards or the BEN and TEL sample, demonstrating that the method was established with specificity, as shown in Figs. 4-6.
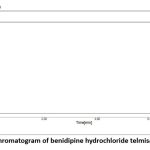 |
Figure 4: Chromatogram of benidipine hydrochloride telmisartan blankClick here to view Figure |
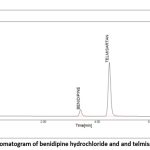 |
Figure 5: Chromatogram of benidipine hydrochloride and and telmisartan sampleClick here to view Figure |
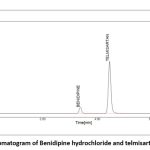 |
Figure 6: Chromatogram of Benidipine hydrochloride and telmisartan standardClick here to view Figure |
Linearity and range
To test the linearity of TEL and BEN, a mixed standard solution containing 50-150 μg/ml and 5-15 μg/ml was used. The TEL and BEN calibration curves showed correlation values of 0.9994 and 0.9992, respectively. Figures 7-8 and Tables 2-3 show this effect.
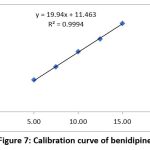 |
Figure 7: Calibration curve of benidipine Click here to view Figure |
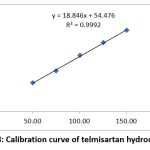 |
Figure 8: Calibration curve of telmisartan hydrochlorideClick here to view Figure |
Precision
Intraday precision
The results for intraday precision for TEL and BEN are shown in Tables 4, 5. For intraday precision, TEL had a percentage RSD of 1.21 and BEN had a % RSD of 0.24.
Interday precision
Tables 1 and 2 contain statistics for TEL and BEN intraday precision. The interday precision of 0.66 TEL and 0.67 BEN was discovered to have a percent RSD.
Table 1: Intraday precision data for estimation of BEN
| Name | Area | RT(min) | %ASSAY |
| Test solution | 213.1641 | 3.38 | 98.67 |
| Test solution | 210.4409 | 3.38 | 98.39 |
| Name | Preparations | % Assay |
| Set-1 | prep-1 | 98.12 |
| prep-2 | 98.27 | |
| Set-2 | prep-1 | 98.67 |
| prep-2 | 98.39 | |
| Mean | 98.36 | |
| SD | 0.2329 | |
| % RSD (NMT 2) | 0.24 |
Table 2: Intraday precision data for estimation of TEL
| Name | Area | RT(min) | %Assay |
| Test solution-1 | 1932.8728 | 4.45 | 101.15 |
| Test solution-1 | 1895.3562 | 4.42 | 98.80 |
| Name | Preparation | %Assay |
| Set-1 | prep-1 | 98.53 |
| prep-2 | 99.98 | |
| Set-2 | prep-1 | 101.15 |
| prep-2 | 98.80 | |
| Mean | 99.62 | |
| SD | 1.2015 | |
| %RSD (NMT 2) | 1.21 | |
Table 3: Interday precision data for estimation of BEN
| Name | Area | RT(min) | %ASSAY |
| Test solution | 209.1348 | 3.37 | 97.78 |
| Test solution | 216.6902 | 3.38 | 99.31 |
| Name | Preparations | % Assay |
| Day-1 | prep-1 | 98.12 |
| prep-2 | 98.27 | |
| Day-2 | prep-1 | 97.78 |
| prep-2 | 99.31 | |
| Mean | 98.37 | |
| SD | 0.6593 | |
| % RSD (NMT 2) | 0.67 |
Table 4: Interday precision data for estimation of TEL
| Name | Area | RT(min) | %Assay |
| Test solution-1 | 1893.7627 | 4.40 | 99.30 |
| Test solution-1 | 1879.0853 | 4.43 | 98.73 |
| Name | Preparation | %Assay |
| Day-1 | prep-1 | 98.53 |
| prep-2 | 99.98 | |
| Day-2 | prep-1 | 99.30 |
| prep-2 | 98.73 | |
| Mean | 99.14 | |
| SD | 0.6510 | |
| %RSD (NMT 2) | 0.66 | |
LOD/LOQ
The SD of the intercepts was computed after five calibration curve iterations. The LOD and LOQ were then determined using the following formulas:
LOD=3.3*SD/slope of calibration curve, LOQ=10*SD/slope of calibration curve
For BEN
LOD = 3.3 X (SD/Slope)
= 3.3 X(3.0426/19.9403)
= 0.50 μg/ml
LOQ = 10 X (SD/Slope)
= 10 X (19.808/76.494)
= 1.53μg/ml
For TEL
LOD = 3.3 X (SD/Slope)
= 3.3 X (34.8392 / 18.8460)
= 6.10 μg/ml
LOQ = 10 X (SD/Slope)
= 10 X (34.8392 / 18.8460)
= 18.49 μg/ml
System suitability test
It’s essential to the chromatographic process. The system’s repeatability and resolution are evaluated to ensure that they are adequate for the analysis. System suitability assessments are based on the idea that when all of the components—equipment, electronics, analytical techniques, and sample—come together, they form a cohesive system that can be evaluated as a whole. Table 5 contains all of the features required for system compatibility testing, ensuring that the technique produces precise and accurate findings for its intended use.
Table 5: Results for system suitability test
| Sr. No. | Name | RT (min) | Area | TP | TF | Resolution |
| 1. | BENIDIPINE | 3.38 | 139.5247 | 13290 | 1.04 | 0.00 |
| 2. | TELMISARTAN | 4.43 | 2698.4956 | 12357 | 1.06 | 7.58 |
Accuracy
The procedure’s correctness was confirmed by recovery analysis on commercial formulations at three levels of standard addition. The results are shown in tables 6, 7, 8 and 9. The percentage recovery for TEL ranged from 98.86 to 101.04%, whereas the range for BEN was found to be 98.34 to 101.46%.
Table 6: Recovery Study of BEN
| Name | Preparations | Area | Amount added μg/ml | Amount recovered μg/ml | Recovery (95-105) % |
| Accuracy at 80 % | Prep-1 | 172.0873 | 8.00 | 7.97 | 99.57 |
| Prep-2 | 175.6127 | 8.10 | 8.13 | 100.36 | |
| Prep-3 | 169.9548 | 8.00 | 7.87 | 98.34 | |
| Accuracy at 100 % | Prep-1 | 221.3835 | 10.10 | 10.25 | 101.46 |
| Prep-2 | 218.4268 | 10.10 | 10.11 | 100.11 | |
| Prep-3 | 221.0120 | 10.10 | 10.23 | 101.29 | |
| Accuracy at 120 % | Prep-1 | 259.4663 | 12.10 | 12.01 | 99.26 |
| Prep-2 | 255.9428 | 12.00 | 11.85 | 98.73 | |
| Prep-3 | 264.6649 | 12.10 | 12.25 | 101.25 |
Table 7: Statistical Validation of Recovery Study
| MEAN % recovery | SD | %RSD (NMT 2) | |
| Accuracy at 80 % | 99.42 | 1.0179 | 1.02 |
| Accuracy at 100 % | 100.95 | 0.7381 | 0.73 |
| Accuracy at 120 % | 99.74 | 1.3287 | 1.33 |
Table 8: Recovery Study of TEL
| Name | Preparations | Area | Amount added μg/ml | Amount recovered μg/ml | Recovery (95-105) % |
| Accuracy at 80 % | Prep-1 | 1539.1315 | 80.20 | 81.03 | 101.04 |
| Prep-2 | 1512.5122 | 80.00 | 79.63 | 99.54 | |
| Prep-3 | 1525.4513 | 80.40 | 80.31 | 99.89 | |
| Accuracy at 100 % | Prep-1 | 1948.3221 | 101.20 | 102.57 | 101.36 |
| Prep-2 | 1911.5549 | 99.80 | 100.64 | 100.84 | |
| Prep-3 | 1921.8163 | 100.60 | 101.18 | 100.57 | |
|
Accuracy at 120 %
|
Prep-1 | 2301.8196 | 120.20 | 121.18 | 100.82 |
| Prep-2 | 2281.0349 | 120.20 | 120.09 | 99.91 | |
| Prep-3 | 2249.5127 | 119.80 | 118.43 | 98.86 |
Table 9: Statistical Validation of Recovery Study
| MEAN % recovery | SD | % RSD (NMT 2) | |
| Accuracy at 80 % | 100.15 | 0.7840 | 0.78 |
| Accuracy at 100 % | 100.92 | 0.3981 | 0.39 |
| Accuracy at 120 % | 99.86 | 0.9819 | 0.98 |
Robustness
The effect of changes was found to be within the acceptance criteria as shown in Tables 10 and 11. The percentage RSD should be <2%.
Table 10: Robustness data for BEN
| SR.NO. | Area at Flow rate 0.9 ml/min | Area at Flow rate 1.1 ml/min | Area at wavelength 235 nm | Area at wavelength 239 | Area at buffer pH 3.35 | Area at buffer pH 3.65 | |
| 1. | 235.6127 | 199.1568 | 237.1048 | 185.0128 | 172.5318 | 255.6127 | |
| 2. | 231.9818 | 202.6159 | 231.5149 | 191.4137 | 175.0318 | 221.9818 | |
| Avg. area | 233.7973 | 200.8864 |
|
188.213 | 173.782 | 223.797 | |
| S.D. | 2.567434 |
|
3.95266 | 4.52612 | 1.76777 | 2.56743 | |
| % RSD | 1.098146 | 1.217581 |
|
2.40478 | 1.01723 | 1.14721 |
Table 11: Robustness data for TEL
| SR.NO. | Area at Flow rate 0.9 ml/min | Area at Flow rate 1.1 ml/min | Area at wavelength 235 nm | Area at wavelength 239 | Area at buffer pH 3.35 | Area at buffer pH 3.65 |
| 1. | 2109.4254 | 1724.3187 | 1910.3156 | 1841.8292 | 1761.8136 | 2027.1206 |
| 2. | 2102.0468 | 1731.9124 | 1935.6418 | 1857.1017 | 1781.4218 | 1997.5525 |
| Avg. area | 2105.736 | 1728.116 | 1922.979 | 1849.465 | 1771.618 | 2012.337 |
| S.D. | 5.217458 | 5.369557 | 17.90833 | 10.79929 | 13.86509 | 20.9078 |
| % RSD | 0.247774 | 0.310717 | 0.931281 | 0.583914 | 0.782623 | 1.038981 |
Forced degradation study
A variety of factors are used to assess the stability of both medications. This study compared the standard area for sample stability and deterioration. When compared to the other materials, BEN has the highest degree of oxidation and heat breakdown. TEL degrades more quickly in an oxidizing and basic atmosphere. Figure 9-13 displays the peaks of all parameters. Table 12 displays the proportion of degradation for each parameter.
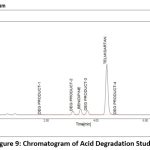 |
Figure 9: Chromatogram of Acid Degradation Study Click here to view Figure |
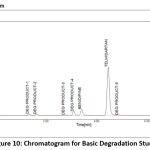 |
Figure 10: Chromatogram for Basic Degradation Study Click here to view Figure |
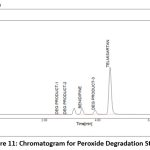 |
Figure 11: Chromatogram for Peroxide Degradation StudyClick here to view Figure |
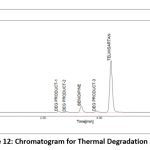 |
Figure 12: Chromatogram for Thermal Degradation StudyClick here to view Figure |
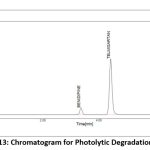 |
Figure 13: Chromatogram for Photolytic Degradation StudyClick here to view Figure |
Table 12: Result for % degradation and % area after degradation
| Stress condition | Min | BENIDIPINE | TELMISARTAN | ||
| % Area BEN observed after degradation | % of degradation of BEN | % Area TEL observed after degradation | % of degradation of TEL | ||
| Acidic | 30 min | 91.68 | 8.32 | 98.53 | 1.47 |
| Basic | 30 min | 87.72 | 12.28 | 91.35 | 8.65 |
| Peroxide | 12 hr | 88.11 | 11.89 | 87.98 | 12.02 |
| Thermal | 1 hr | 91.77 | 8.23 | 97.39 | 2.61 |
| Photolytic | 1 hr | 98.64 | 1.36 | 99.56 | 0.44 |
Analysis of a commercial sample
It is possible to analyse BEN and TEL in their marketed tablet dose form of 1121.25 mg using the suggested methods. The accuracy of the percent assay values for telmisartan and benidipine were found to be 100.87 % and 98.74 %, respectively. Table 13 provides a summary of the work.
Table 13: The proposed method’s assay results
| Parameters | Benidipine | Telmisartan |
| Area | 218.7671 | 1882.7360 |
| Amount found | 4.03 | 39.50 |
| % Assay | 100.87 % | 98.74 % |
Discussion
At room temperature, the current technique was created by mixing methanol and an ammonium dihydrogen orthophosphate (pH 3.5) buffer in an 80:20 ratio. The redesigned strategy was more practical and cost-effective. The stability indicating RP-HPLC is in charge of the specific interaction between the active medicinal components and any degradation products produced at the defined conditions. The chemical and its degradants were successfully isolated using the technique outlined below.
Conclusion
An RP-HPLC method was developed using a UV/Vis detector to identify Telmisartan and Benidipine Hydrochloride in tablets at the same time. The unique approach’s specificity, linearity, and range, precision, accuracy, and robustness were all evaluated in accordance with ICH guidelines. The results confirmed the accuracy, speed, economy, and resilience of a method designed and validated to separate components using good chromatographic criteria. The technique’s pieces are easily distinguishable, and it may be used immediately.
Acknowledgement
The author would like to thank Kamla Nehru College of Pharmacy, Butibori, Nagpur for providing us the facility for carrying out the research work.
Funding Sources
The author(s) received no financial support for the research, authorship, and/or publication of this article.
Conflict of Interest
The authors do not have any conflict of interest.
Data Availability Statement
This statement does not apply to this article.
Ethics Statement
This research did not involve human participants, animal subjects, or any material that requires ethical approval.
Informed Consent Statement
This study did not involve human participants, and therefore, informed consent was not required.
Clinical Trial Registration
This research does not involve any clinical trials.
Permission to reproduce material from other sources
Not Applicable
Author Contribution
Anuja Shrikhande, Mithali Palandurkar and Swati Vidhate: carried out experiments writing – original draft, data collection and analysis and contributed to visualization and project administration, also contributed to writing, experimentation and result reporting.
Parimal Katolkar, Shubham Amadare: conceptualization, RP-HPLC chromatogram data analysis of results, methodology planning, and manuscript preparation, carried out resources and research supervision.
References
- Tripathi KD. Essentials of Medical Pharmacology. New Delhi: Jaypee Brothers Medical Publishers (P) Ltd. 2008:778-9.
CrossRef - Patel DM, Patel D, Patel A, Sheth A, Shah UJ. Method development and validation for simultaneous estimation of benidipine hydrochloride and metoprolol succinate in tablet. Journal of Drug Delivery and Therapeutics. 2019 Dec 15;9(6-s):28-33.
CrossRef - Naim M, Ahmed A, Gj KH. Stability indicating reverse-phase high-performance liquid chromatography method development and validation for simultaneous estimation of telmisartan and benidipine hydrochloride in pharmaceutical dosage form. Asian J Pharm Clin Res. 2018;11(5):342-50.
CrossRef - Patel JM, Dhingani AP, Garala KC, Raval MK, Sheth NR. Development and validation of bioanalytical HPLC method for estimation of telmisartan in rat plasma: application to pharmacokinetic studies. Dhaka University Journal of Pharmaceutical Sciences. 2012;11(2):121-7.
CrossRef - Ruilope LM. Telmisartan for the management of patients at high cardiovascular risk. Current medical research and opinion. 2011 Aug 1;27(8):1673-82.
CrossRef - Moffat AC, Osselton MD, Widdop B. Clarke’s Analysis of Drugs and Poisons, 3rd edn, vol. 2. London: Royal Pharmaceutical Society. 2004:743.
- Nakatani M, Takeshi S, Ohki T, Toyoshima K, inventors; Boehringer Ingelheim International GmbH, assignee. Solid telmisartan pharmaceutical formulations. United States patent US 8,980,870. 2015 Mar 17.
- Martindale C. The complete drug reference. Sweetman SC, editor. London: Pharmaceutical press; 2009 Mar.
- Dong MW. Modern HPLC for practicing scientists. John Wiley & Sons; 2006 May 19.
CrossRef - Swartz M, Krull I. Developing and Validating Stability-Indicating Methods by Michael Swartz and Ira Krull.
- Naim M, Ahmed A, Gj KH. Stability indicating reverse-phase high-performance liquid chromatography method development and validation for simultaneous estimation of telmisartan and benidipine hydrochloride in pharmaceutical dosage form. Asian J Pharm Clin Res. 2018;11(5):342-50.
CrossRef - Snyder LR, Kirkland JJ, Dolan JW. Introduction to modern liquid chromatography. John Wiley & Sons; 2011 Sep 20.
- Patel BA, Captain AD. DEVELOPMENT AND VALIDATION OF RP-HPLC METHOD FOR ESTIMATION OF TELMISARTAN IN BULK AND FORMULATION USING FLUORESCENCE DETECTOR. Journal of Biomedical and Pharmaceutical Research. 201
Abbreviations
BEN: benidipine hydrochloride;
TEL: Telmisartan;
ICH: International Conference On Harmonization;
RP-HPLC: Reverse phase high-performance liquid chromatography ;
AR: Analytical reagent;
RT: Retention time;
RSD: relative standard deviation.
MeOH: methanol,
OPA: orthophosphoric acid,
TFA: Trifluoracetic Acid
NaOH: whereas Sodium Hydroxide
LOD and LOQ: “limit of detection” and “limit of quantitation,” respectively.
HCL: Hydrochloric acid
H2O2: Hydrogen peroxide

This work is licensed under a Creative Commons Attribution 4.0 International License.


