

Manuscript accepted on : 16-04-2025
Published online on: 07-05-2025
Plagiarism Check: Yes
Reviewed by: Dr. Nkoyo Nubila
Second Review by: Dr. Samara Sameer Yonus
Final Approval by: Dr. Eugene A. Silow
Khagga Bhavya Sri*, Thandra Ambika and Mogili Sumakanth
Department of Pharmaceutical Analysis, Osmania University, RBVRR women’s college of pharmacy, Hyderabad, Telangana, India.
Corresponding Author E-mail: id-bhavya.kagga@gmail.com
DOI : http://dx.doi.org/10.13005/bbra/3386

ABSTRACT: Our research indicates that chromogen method has beendeveloped fordabigatran, however, for plasma analysis we incorporated a chromogenic approach specifically for dabigatran in plasma. To ensure a simple and accurate assessment, a spectrophotometric technique has to be developed and validated for for the quantiifcation ofdabigatran etexilate mesylate (DAB) in bulk and pharmaceutical dose forms. This method uses the 1-Naphthol reagent, which yields a colored complex facilitating precise measurement.To develop a novel, straightforward, accurate, repeatable, and exact chromogenic UV-visible spectroscopy, and bioanalytical technique, for measuring dabigatran etexilate mesylate in pharmaceutical formulations and bulk. In the presence of Sodium Nitrite and HCl with Ammonium Sulfamate, amine undergoes diazotization. DAB and 1-Naphthol react to generate a green complex that can be detected at 449 nm. Chromogenic method was used for quantification of dabigatran in incurred plasma and quality control samples. Method development and validation for quantification of dabigatran was developed and validated.Human serum UV-visible spectroscopy was created and verified. Plasma was extracted with protein precipitation by acetonitrile. Recoveries for both incurred plasma and quality control sample exceeded 89.48% while accuracy fell below 101.26% and 101.96% respectively and RSD less than 10% each. Overall, we conclude that the method developed was sensitive and accurate for easy analysis of plasma incorporated with chromophore/reagent. The findings of results are more accurate data and validated as per proceeded guidelines i.e, M10.
KEYWORDS: Dabigatran Etexilate Mesylate (DAB); Method validation; 1-Naphthol; Plasma; Stability studies; UV-visible spectrophotometer
Download this article as:| Copy the following to cite this article: Sri K. B, Ambika T, Sumakanth M. Quantification of Dabigatran in Spiked Human Plasma in Bulk and Formulations as Per M10 Guidelines by Spectroscopic Technique. Biotech Res Asia 2025;22(2). |
| Copy the following to cite this URL: Sri K. B, Ambika T, Sumakanth M. Quantification of Dabigatran in Spiked Human Plasma in Bulk and Formulations as Per M10 Guidelines by Spectroscopic Technique. Biotech Res Asia 2025;22(2). Available from: https://bit.ly/4d9dF22 |
Introduction
Dabigatran is an anticoagulant which is used to treat and prevent blood clots. The FDA approved Dabigatran etexilate mesylate on October 19, 2010. The mechanism of action involves binding to thrombin: dabigatran reversibly binds to the active site on the thrombin molecule, preventing thrombin-mediated activation of coagulation factors. Fibrin-bound inactivation: Even when thrombin is fibrin-bound, dabigatran can still inactivate it. This property reduces thrombin-mediated inhibition of fibrinolysis, potentially enhancing fibrinolysis. This prodrug degrades in the liver and plasma cells to its active form in the presence of esterase .. Thrombin is quickly and reversibly suppressed competitively by DAB.1-3
A thorough review of the literature found that few analytical techniques are available for determining DAB using UV spectroscopy, RP-HPLC, or HPLC.4-8
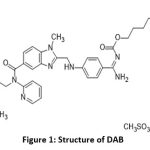 |
Figure 1: Structure of DABClick here to view Figure |
Ultraviolet-visible (UV-Vis) spectroscopy is a commonly used technique in many scientific fields, from chemical research and quality control in the beverage industry to bacterial culture, medication identification, and nucleic acid purity checks and quantification 9-12. Based on the UV-visible spectrophotometer instrumentation, the intensity of light can be reasonably expected to be quantitatively related to the amount of light absorbed by the sample. A single beam spectrophotometer measures the intensity of light before and after it passes through the sample.13 A double beam spectrophotometer splits the light into two beams: one passes through the sample, and the other passes through a reference.14
A biological assay of plasma with a drug typically involves measuring the concentration of the drug in plasma to assess its pharmacokinetics, bioavailability, and therapeutic efficacy. Bioanalytical method validation (BMV) is a critical process in pharmaceutical research and development. It ensures that the methods used to measure drugs and their metabolites in biological matrices (like blood or urine) are reliable, accurate, and consistent. The validation process typically involves evaluating parameters such as accuracy, precision, specificity, linearity, and stability.15
Biological sample extraction techniques are essential for isolating specific components from biological samples for analysis. This method involves adding a precipitating agent (like acetonitrile or methanol) to the sample to denature and precipitate proteins, leaving the analytes in the supernatant.
Chromogenic assays are detection methods that rely on a color change to obtain qualitative and quantitative results. These assays are widely used in biochemical and pharmaceutical research. A chromogen is a chemical compound that can be converted into a colored compound, or chromophore, through a chemical reaction. Chromogens can be colorless or have a faint color.16
Materials and methods
Dabigatran etexilate mesylate standard drug, Sodium Nitrite, Ammonium Sulphmate, 1-Naphthol, Ethanol, Acetone, Plasma procured from the blood bank.Instruments used for analysis: Double Beam UV-visible spectrophotometer ELICO SL-210, Centrifuge REMI R-4C.
Preparation of Standard Stock Solution (1000µg/ml)
Weighed accurately 10mg of pure DAB and transferred it into a 10ml volumetric flask. Dissolved the drug with ethanol and make up the volume up to the mark. The resultant solution of standard stock was 1000µg/ml.
Preparation of Working Standard Solution (100µg/ml)
Pipetted out 1ml of stock solution into 10 volumetric flasks and marked up to the volume with ethanol. The resultant solution of the working standard was 100µg/ml.
Preparation of Standard solution (10 µg/ml)
Pipetted out 1.0ml from working standard solution into 10ml volumetric flask and made up to the mark with ethanol.
Preparation of Spiked sample and Extraction
1 ml of plasma was pipetted out into a test tube and 1 ml of 10ppm drug was added to the above plasma sample. Then 2 ml of acetone was transferred to the test tube. The solution was vortexed for 1min. After vortexing the contents were transferred into a centrifugation tube at 14,000rpm for 10 minutes. The supernatant layer was collected into a 10-ml vol flask.
Preparation of blank plasma
1ml of plasma was measured and transferred to a 10ml volumetric flask followed by the addition of 9ml of ethanol.
Preparation of 2M HCl
Pipetted out 4.3ml of conc. HCl (37%) into a 25ml volumetric flask made up of water up to the mark. The resultant solution was found to be 2M HCl.
Preparation of 0.025% Sodium Nitrite
We weighed accurately 25mg of Sodium Nitrite and transferred it into a 100 volumetric flask. Dissolved with water and made up to the mark with water. The resultant solution was found to be 0.025% Sodium Nitrite.
Preparation of 0.5 % Ammonium Sulphamate
We weighed accurately 0.5g of Ammonium Sulphamate in 100 ml of the volumetric flask, diluted with water, and the remaining volume was brought up to mark with diluent. The resultant solution was to be 0.5% Ammonium Sulphamate.
Preparation of 0.250% 1-Naphthol
Weighed accurately 250mg of 1-Naphthol and diluted it with ethanol and the remaining solution was brought up to the mark with ethanol in a 100 ml volumetric flask. The resultant solution found was to be 0.250%1-Naphthol.
Preparation of Reagent Blank
1ml of plasma was measured and transferred to a 10ml volumetric flask followed by the addition of 1ml of HCl, 1ml of Sodium Nitrite, 1ml of Ammonium Sulphamate, and 1ml of 1-naphthol in 10ml volumetric flask. Water was added to the remaining solution in a 10ml volumetric flask.
Quantification Of Dabigatran in Spiked Plasma Formulation in Bulk Samples Using 1 – Naphthol
Extraction Procedure
The bioanalytical method used a protein precipitation extraction procedure.17-22 Plasma was taken from the refrigerator and allowed to thaw at room temperature on the analysis day. 1 ml of Human plasmawas taken into a test tube and 1 ml of 10ppm drug was added to the above plasma sample. Then 2 ml of acetone was transferred to the test tube. The solution was vortexed for 1min. After vortexed the contents were transferred into a centrifugation tube at 14,000rpm for 10 minutes. The supernatant layer was collected into a 10-ml vol flask. 2 ml of the supernatant solution was transferred to a 10ml volumetric flask. 1 ml of 2MHCl and 1 ml of Sodium Nitrite (0.025%) were added to the above solution. After 2mins 1ml of Ammonium Sulphamate (0.5%) was added to the flask. After 3mins 1ml of 1-Naphthol (0.25%) was added. The solution was brought up to the mark with ethanol. 23-29 The resultant solution was scanned in the 400–800 nm range using UV–visible spectroscopy against a reagent blank. It has been found that the optimal wavelength, which corresponds to green chromogen, was 449 nm. 30-32 The recovery studies were found to be 98.24%.
Validation Parameters as Per M10 Guidelines33-39
Selectivity
Selectivity is the capacity of an analytical technique to recognize and quantify an analyte in the presence of other chemicals or any substance that disturbs the biological matrix.
Specificity
The ability of a bioanalytical approach to differentiate between and recognize products made from various materials, particularly related molecules, is known as specificity.
Matrix effect
A change in the analyte reaction caused by intervening and sometimes undetectable components in the sample matrix is known as a matrix effect.
Preparation of low QC (5ppm) and high QC (45ppm)
Three different 10 ml vol flasks were pipetted with 0.5 ml and 4.5ml of the standard DAB solution and 1ml of plasma from three different sources, the drug solution was received after centrifugation. The supernatant layer was collected and three replicates were prepared for each concentration followed by reagents added. The solution was made up to the mark with water. UV-visible spectroscopy was used to scan the resulting solution at 449 nm against the corresponding reagent blank.
Calibration curve
The calibration curve illustrates the relationship between an analyte’s real concentration and the testing platform’s reaction to it. The calibration curve is made up of the calibration standards, which are created by combining a certain quantity of analytes or analytes into a matrix.
Procedure for establishing of Calibration curve
A series of 10 ml volumetric flasks were filled with aliquots of the standard drug solution of DAB in the following sizes: 0.5, 1.0, 1.5, 2.0, 2.5, 3.0, 3.5, 4.0, and 4.5 ml. Each 10ml vol flask received a spike of 1ml plasma. They added 1 ml of 2MHCl, 1 ml of 0.5% ammonium sulfamate, 1 ml of 0.02% sodium nitrite, and 1 ml of 0.25% 1-naphthol. Ethanol makes up the difference in the solution. The equivalent reagent blank was used to compare the green chromogen of dab absorbance at 449 nm. The calibration curve’s linearity (absorbance vs. concentration) for dab was examined in pure solution using concentration ranges of 5, 10, 15, 20, 25, 30, 35, 40, and 45 µg/ml.
Accuracy and Precision
Accuracy and precision should be assessed using identical runs and data.
Preparation Accuracy and Precision samples
A series of 10 ml volumetric flasks were filled with aliquots of the standard drug solution of DAB in the following sizes: 0.5 ml, 1.5 ml, 3.0 ml, and 4.0 ml. Each 10ml vol flask received a spike of 1ml plasma. The drug solution was received after centrifugation. The supernatant layer was collected followed by reagents added. The solution was made up to the mark with water. The LLQC, LQC, MQC, and HQC were observed and recorded in the results. UV-visible spectroscopy was used to scan the resulting solution at 449 nm against the corresponding reagent blank. The mean ± standard deviation was determined for five QC samples.
Stability
Stability studies must be conducted to make sure that choices regarding sample preparation, production, analysis, and storage conditions do not affect the analyte concentration. The material’s endurance in the matrix is evaluated using QCs at both low and high concentrations.
Benchtop stability
Both high and low QCs should be thawed on the tabletop for the same amount of time and at the same temperature as the research materials.
Preparation of low QC (5µg/ml) high QC (45µg/ml) sample
A 10 ml vol flask that had been previously spiked with plasma was filled with 0.5 ml and 4.5ml of the standard drug sol (100µg/ml). The supernatant layer was collected followed by reagents were added for each concentration. The remaining volume was filled with water to reach the mark. For a longer period, the three low-concentration replicas were created and kept in a freezer at -20°C. A UV scan of the solution at 449 nm was performed after a specific amount of time to document any changes.
Reinjection reproducibility
Following storage, a run that includes a minimum of five replicas of all medium, low, and high QCs as well as calibration standards is reinjected to evaluate injection repeatability. The viability of the treated samples is determined by the reinjected QCs’ accuracy as well as precision.
Preparation of low QC (5µg/ml) and high QC (45µg/ml) sample
A 10 ml vol flask that had been previously spiked with plasma was filled with 0.5 ml and 4.5ml of the standard drug sol (100µg/ml). The supernatant layer was collected followed by reagents were added for each concentration. The remaining volume was filled with water to reach up to the mark. UV-visible spectroscopy was used to scan the resulting solution at 449 nm against the corresponding reagent blank. The samples were reinjected to know any deviations in the prepared sample for analysis.
Validation Parameters for UV Spectroscopy in Spiked with Plasma as Per M10 Guidelines
Bioanalytical Extraction Procedure
The bioanalytical method used a protein precipitation extraction procedure. Plasma was taken from the refrigerator and allowed to thaw at room temperature on the analysis day. 1 ml of Human plasmawas taken into a test tube and 1 ml of 10ppm drug was added to the above plasma sample. Then 2 ml of acetone was transferred to the test tube. The solution was vortexed for 1min. After vortexed the contents were transferred into a centrifugation tube at 14,000rpm for 10 minutes. The supernatant layer was collected into a 10-ml vol flask. 2 ml of supernatant solution was transferred to a 10-ml volumetric flask. The solution was brought up to the mark with ethanol. The resultant solution was scanned in UV spectroscopy against a blank at 325nm. 32-39
Calibration curve
Procedure for establishing of calibration curve
A series of 10 ml volumetric flasks were filled with aliquots of the standard drug solution of DAB in the following sizes: 0.5, 1.0, 1.5, 2.0, 2.5, 3.0, 3.5, and 4.0 ml. Each 10ml vol flask received a spike of 1ml plasma. The calibration curve’s linearity (absorbance vs. concentration) for dab was examined in pure solution using concentration ranges of 5, 10, 15, 20, 25, 30, 35, and 40 µg/ml.
Accuracy and Precision
Preparation Accuracy and Precision samples
A series of 10 ml volumetric flasks were filled with aliquots of the standard drug solution of DAB in the following sizes: 0.5 ml, 1.5 ml, 3.0 ml, and 4.0 ml. Each 10ml vol flask received a spike of 1ml plasma. The drug solution was received after centrifugation. The supernatant layer was collected. The solution was made up to the mark with water. The LLQC, LQC, MQC, and HQC were observed and recorded in the results. UV spectroscopy was used to scan the resulting solution at 325 nm against the corresponding blank. The mean ± standard deviation was determined for five QC samples.
Matrix effect
Preparation of low QC (5ppm) and high QC (45ppm)
A 10 ml volumetric flask was pipetted with 0.5 ml and 4.5ml of the standard DAB solution and 1 ml of plasma, the drug solution was received after centrifugation. The supernatant layer was collected and three replicates were prepared. The solution was made up to the mark with water. UV-visible spectroscopy was used to scan the resulting solution at 325 nm against the corresponding blank.
Bench-top (short-term) stability
Preparation of low QC (5µg/ml) and high QC (45µg/ml) sample
A 10 ml vol flask that had been previously spiked with plasma was filled with 0.5 ml and 4.5ml of the standard drug sol (100µg/ml). The supernatant layer was collected. The remaining volume was filled with water to reach the mark. For a longer period, the three low-concentration replicas were created and kept in a freezer at -20°C. A UV scan of the solution at 325 nm was performed after a specific amount of time to document any changes.
Reinjection reproducibility
Preparation of low QC (5µg/ml) and high QC (45µg/ml) sample
A 10 ml vol flask that had been previously spiked with plasma was filled with 0.5ml and 4.5ml of the standard drug sol (100µg/ml). The supernatant layer was collected. The remaining volume was filled with water to reach up to the mark. UV-visible spectroscopy was used to scan the resulting solution at 325nm against the corresponding blank. The samples were reinjected to know any deviations in the prepared sample for analysis.
Results
Validation parameters of dabigatran in spiked plasma as per M10 guidelines
Calibration curve
Table 1: Calibration range of DAB in spiked plasma with ethanol
| S. No | Concentration(µg/ml) | Absorbance(449nm) | Absorbance(325nm) |
| 1. | 5 | 0.1347 | 0.1458 |
| 2. | 10 | 0.2916 | 0.2916 |
| 3. | 15 | 0.4391 | 0.4616 |
| 4. | 20 | 0.5993 | 0.6081 |
| 5. | 25 | 0.7437 | 0.7953 |
| 6. | 30 | 0.9206 | 0.9424 |
| 7. | 35 | 1.0843 | 1.0937 |
| 8. | 40 | 1.2125 | 1.2418 |
| 9. | 45 | 1.4226 | – |
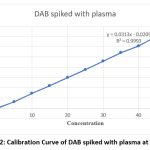 |
Figure 2: Calibration Curve of DAB spiked with plasma at 449nmClick here to view Figure |
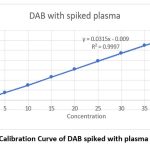 |
Figure 3: Calibration Curve of DAB spiked with plasma at 325nmClick here to view Figure |
Precision
Table 2: Between-run precision data of dabigatran for the day-1 and 2 at 449nm
| B/W the run (Day-1) | 5ppm (LLQC) | 15ppm (LQC) | 30ppm (MQC) | 45ppm (HQC) |
| 0.5809 | 0.9514 | 1.5348 | 1.4226 | |
| 0.5425 | 0.9521 | 1.5317 | 1.4351 | |
| 0.5401 | 0.9401 | 1.7336 | 1.4215 | |
| Average | 0.141166667 | 0.347866667 | 0.733366667 | 1.4264 |
| SD | 0.00122202 | 0.016735231 | 0.001563117 | 0.007554469 |
| %RSD | 12.865657746 | 11.936152958 | 11.213142568 | 12.52961784 |
| B/W the run (Day-2) | 5ppm (LLQC) | 15ppm (LQC) | 30ppm (MQC) | 45ppm (HQC) |
| 0.1453 | 0.3641 | 0.7421 | 1.5281 | |
| 0.1445 | 0.3635 | 0.7426 | 1.5091 | |
| 0.1439 | 0.3659 | 0.7428 | 1.5164 | |
| Average | 0.144566667 | 0.3645 | 0.7425 | 1.517866667 |
| SD | 0.010702377 | 0.0101249 | 0.010360555 | 0.01095836 |
| %RSD | 13.485849839 | 11.34266107 | 11.048559613 | 11.631447832 |
Table 3: Between-run precision data of dabigatran for the day –1 and 2 at 325nm
| B/W the run (Day-1) | 5ppm (LLQC) | 15ppm (LQC) | 30ppm (MQC) | 45ppm (HQC) |
| 0.6809 | 0.9814 | 1.6348 | 1.8226 | |
| 0.6425 | 0.9621 | 1.6317 | 1.8351 | |
| 0.6401 | 0.9901 | 1.6336 | 1.48215 | |
| Average | 0.141166667 | 0.347866667 | 0.733366667 | 1.4264 |
| SD | 0.00122202 | 0.016735231 | 0.001563117 | 0.007554469 |
| %RSD | 12.165657746 | 11.636152958 | 11.293142568 | 12.92961784 |
| B/W the run (Day-2) | 5ppm (LLQC) | 15ppm (LQC) | 30ppm (MQC) | 45ppm (HQC) |
| 0.1553 | 0.5641 | 0.9421 | 1.9281 | |
| 0.1545 | 0.5635 | 0.9426 | 1.9091 | |
| 0.1539 | 0.5659 | 0.9428 | 1.9164 | |
| Average | 0.144566667 | 0.5645 | 0.9425 | 1.9178 |
| SD | 0.010702377 | 0.0101249 | 0.010360555 | 0.01095836 |
| %RSD | 12.485849839 | 11.04266107 | 11.648559613 | 11.431447832 |
Standard deviation (SD) = S=∑(xi−x)2 / n−1
%RSD = (standard deviation / |mean|) * 100%
Accuracy and precision were validated as per M10 guidelines. The accuracy at each concentration level should be within ±15% of the nominal concentration, except at the LLOQ, where it should be within ±20%. The precision (%CV) of the concentrations determined at each level should not exceed 15%, except at the LLOQ, where it should not exceed 20%.
Accuracy
Table 4: Within-run precision data of dabigatran for each run at 449nm.
| within the run | 5ppm (LLQC) | 15ppm (LQC) | 30ppm (MQC) | 45ppm (HQC) |
| 0.1429 | 0.3514 | 0.7368 | 1.1159 | |
| 0.1425 | 0.3598 | 0.7397 | 1.1067 | |
| 0.1421 | 0.3541 | 0.7308 | 1.0681 | |
| 0.1448 | 0.3562 | 0.7361 | 1.0982 | |
| 0.1437 | 0.3572 | 0.7379 | 1.0734 | |
| 0.1457 | 0.3527 | 0.7374 | 1.0956 | |
| Average | 0.14361667 | 0.355233333 | 0.73645 | 1.092983333 |
| SD | 0.0014006 | 0.003100108 | 0.003024401 | 0.018708652 |
| %RSD | 12.9752316 | 11.872696122 | 10.410672926 | 12.711705167 |
Table 5: Within-run precision data of dabigatran for each run at 325nm.
| within the run | 5ppm (LLQC) | 15ppm (LQC) | 30ppm (MQC) | 45ppm (HQC) |
| 0.1529 | 0.5514 | 0.9368 | 1.3159 | |
| 0.1525 | 0.5598 | 0.9397 | 1.3067 | |
| 0.1521 | 0.5541 | 0.9308 | 1.3681 | |
| 0.1548 | 0.5562 | 0.9361 | 1.3982 | |
| 0.1537 | 0.5572 | 0.9379 | 1.3734 | |
| 0.1557 | 0.5527 | 0.9374 | 1.3956 | |
| Average | 0.15361667 | 0.555233333 | 0.93645 | 1.392983333 |
| SD | 0.0014006 | 0.003100108 | 0.003024401 | 0.018708652 |
| %RSD | 12.5752316 | 11.102696122 | 10.010672926 | 12.091705167 |
Matrix effect
Table 6: Matrix effect of dabigatran with Low QC and High QC sample at 449nm
| LQC | Matrix-1 | Matrix-2 | Matrix-3 |
| 5ppm | 0.1496 | 0.1509 | 0.1295 |
| 5ppm | 0.1459 | 0.1549 | 0.1263 |
| 5ppm | 0.1489 | 0.1526 | 0.1284 |
| Mean | 0.1481 | 0.1528 | 0.128066667 |
| SD | 0.001965 | 0.002007486 | 0.001625833 |
| %RSD | 10.3268 | 13.313799732 | 12.269520916 |
| HQC | Matrix-1 | Matrix-2 | Matrix-3 |
| 45ppm | 1.2046 | 1.2284 | 1.1985 |
| 45ppm | 1.2094 | 1.2293 | 1.1992 |
| 45ppm | 1.2051 | 1.2308 | 1.2057 |
| Mean | 1.2063 | 1.2295 | 1.201133333 |
| SD | 0.00263 | 0.001212 | 0.003970306 |
| %RSD | 12.21874 | 11.098612 | 10.330546688 |
Table 7: Matrix effect of dabigatran with Low QC and High QC sample at 325nm
| LQC | Matrix-1 | Matrix-2 | Matrix-3 |
| 5ppm | 0.1596 | 0.1709 | 0.1695 |
| 5ppm | 0.1359 | 0.1749 | 0.1263 |
| 5ppm | 0.1089 | 0.1426 | 0.1584 |
| Mean | 0.1081 | 0.1628 | 0.1514 |
| SD | 0.001965 | 0.017607669 | 0.022434572 |
| %RSD | 11.817761332 | 10.81552137 | 14.81807895 |
| HQC | Matrix-1 | Matrix-2 | Matrix-3 |
| 40ppm | 1.2046 | 1.5284 | 1.1985 |
| 40ppm | 1.2094 | 1.2293 | 1.4992 |
| 40ppm | 1.4051 | 1.3308 | 1.2057 |
| Mean | 1.2063 | 1.362833 | 1.301133333 |
| SD | 0.00263 | 0.152101 | 0.171568538 |
| %RSD | 10.21874 | 11.16067 | 13.18608431 |
Benchpoint stability studies
Table 8: Stability study of dabigatran at LQC (5ppm) and HQC (45ppm) at 449nm.
| 0hours | 2hours | 4hours | 6hours | 8hours |
| 88.23% | 89.24% | 92.74% | 94.61% | 96.34% |
| 88.94% | 90.12% | 92.84% | 94.76% | 96.71% |
| 89.23% | 90.85% | 92.54% | 95.02% | 97.24% |
| Mean: 88.80% | 90.07% | 92.71% | 94.80% | 96.76% |
| SD: 0.005145 | 0.008062 | 0.001528 | 0.002074 | 0.004524 |
| 0hours | 2hours | 4hours | 6hours | 8hours |
| 90.42% | 92.84% | 93.84% | 94.81% | 98.34% |
| 91.24% | 93.04% | 94.28% | 95.21% | 98.42% |
| 91.67% | 93.62% | 94.51% | 95.63% | 99.17% |
| Mean: 91.11% | 93.17% | 94.21% | 95.22% | 98.64% |
| SD: 0.006351 | 0.004051 | 0.003404 | 0.0041 | 0.004579 |
Table 9: Stability study of dabigatran at LQC (5ppm) and HQC (45ppm) at 325nm
| LQC 0hours | 2hours | 4hours | 6hours | 8hours |
| 86.41% | 88.00% | 89.37% | 91.65% | 105.86% |
| 86.34% | 88.91% | 90.18% | 92.45% | 113.28% |
| 89.75% | 89.30% | 89.64% | 98.41% | 111.06% |
| 87.50% | 88.74% | 89.73% | 94.17% | 110.07% |
| 0.019488715 | 0.006671082 | 0.004124318 | 0.036936703 | 0.038084292 |
| HQC 0hours | 2hours | 4hours | 6hour | 8hours |
| 89.55% | 90.64% | 92.05% | 95.02% | 90.94% |
| 98.22% | 90.89% | 91.94% | 96.51% | 113.74% |
| 106.03% | 91.24% | 91.69% | 96.98% | 105.52% |
| 97.93% | 90.92% | 91.89% | 96.17% | 103.40% |
| 0.08243739 | 0.00301385 | 0.001844813 | 0.01023279 | 0.115468957 |
Reinjection reproducibility
Table 10: Reinjection reproducibility data at 449nm and 325nm
| Reinjection reproducibility | |||
| Low QC (5ppm)449nm | High QC (45ppm)449nm | Low QC (5ppm)325nm | High QC (40ppm)325nm |
| 0.1359 | 1.2828 | 0.1759 | 1.6828 |
| 0.1355 | 1.2638 | 0.1455 | 1.3638 |
| 0.1361 | 1.2525 | 0.1361 | 1.2525 |
| 0.1348 | 1.2527 | 0.1348 | 1.2527 |
| 0.1357 | 1.2906 | 0.1657 | 1.4906 |
| Average: 0.1356 | 1.26848 | Mean: 0.1516 | 1.40848 |
| SD: 0.0105 | 0.017469 | SD: 0.018364 | 0.182064 |
| %RSD: 12.368732 | 10.37714 | %RSD: 12.1137 | 12.92625 |
Discussion
Chromatography and UV-visible spectroscopy methods both demonstrate strengths in the quantitative determination of apixaban, dabigatran, rivaroxaban, edoxaban, and their metabolites in biological samples. The chromatographic method provides a broad calibration range of 10–750 µg/mL, which is suitable for diverse concentrations, along with superior accuracy (>92%) and precision (<3.7% and <3.6%), ensuring high reliability and reproducibility. In contrast, the UV-visible spectroscopy method offers a narrower calibration range of 5–45 µg/mL, with comparatively lower accuracy and precision (11–15%), limiting its application in critical analyses. However, spectroscopy excels in stability and matrix effect studies (below 15%), combined with minimal solvent consumption, making it an eco-friendly and cost-effective choice. While chromatography stands out for its high sensitivity and applicability in complex analyses, spectroscopy is a practical alternative for routine tasks, emphasizing simplicity and efficiency. The bioanalytical method shows adequate accuracy, precision, stability, and minimal matrix effects, making it appropriate for the intended applications.
Conclusion
A validated UV-visible spectrophotometric method has been developed for quantifying dabigatran etexilate mesylate (DAB) in human plasma and pharmaceutical dosage forms. The method demonstrates reliability and practicality, meeting all regulatory requirements for selectivity, sensitivity, linearity, accuracy, precision, and stability. Its advantages include low solvent concentration, lack of extraction stages, specificity, sensitivity, and cost-effectiveness, making it suitable for regular use in quality control applications. Despite slightly elevated %RSD values compared to typical HPLC methods, the technique remains within acceptable limits for bioanalytical applications.
Acknowledgement
The author would like to thank RBVRR women’s college of pharmacy for granting the Master’s research work. The author is profoundly grateful to the principal and head of the department of pharmaceutical analysis for their guidance during the research procurement.
Funding Sources
The author(s) received no financial support for the research, authorship, and/or publication of this article.
Conflict of Interest-
The authors do not have any conflict of interest.
Data Availability Statement
This statement does not apply to this article.
Ethics Statement
This research did not involve human participants, animal subjects, or any material that requires ethical approval.
Informed Consent Statement-
This study did not involve human participants, and therefore, informed consent was not required.
Clinical Trial Registration
This research does not involve any clinical trials.
Permission to reproduce material from other source
Not Applicable
Author Contributions
Khagga Bhavyasri: Conceptualization, Supervision, Project Administration.
Thandra Ambika: Data Collection, Methodology, Writing-Original Draft, Review & Editing
Mogili Sumakanth: Funding Acquisition, Resources.
References
- Graeme J Hankey, John Eikelboom. “Dabigatran etexilate: A new oral thrombin inhibitor”. Circulation. 2011; 123: 1436–50.
CrossRef - Joanne van Ryn, Ashley Goss, Norbert Hauel, WolfgangWienen, Henning Priepke, Herbert Nar and Andreas Clemens. The discovery of dabigatran etexilate. Frontiers in Pharmacology. 2013; 4(12): 1-8.
CrossRef - Khasim Sharif SD., Sri Ramudu B., Rambabu Nunna and Ramchandran D. An improved process for preparation of Dabigatran etexilate mesylate. Asian Journal of chemistry. 2017; 29(6): 1253-1257.
CrossRef - Yeragodala Narendra Reddy and Jadi Sreeramulu. Development And Validation of Stability-Indicating RP-HPLC Method For Estimation of Dabigatran Etexilate Mesylate. European Journal of Biomedical and Pharmaceutical Sciences. 2020; 7(4): 336-339.
- Dipali M Atole, Hrishikesh H Rajput. Ultraviolet spectroscopy and its pharmaceutical applications- a brief review. Asian J Pharm Clin Res. 2018; 11(2): 2018, 59-66.
CrossRef - Rajni Dubey, Ashish Kumar, Bhaskar Kumar Gupta. A review of UV-visible spectroscopy: techniques and applications. International Journal of Novel Research and Development. 2024; 9(10): b412-b423.
- Rutuja S Shah, Rutuja R Shah, Rajashri B Pawar, and Pranit P Gayakar. UV-Visible spectrophotometry-a review. International journal of institutional pharmacy and life sciences. 2015; 5(5): 490-505.
- Khagga bhavyasri. Samreen begum, Suchitra D., Narmad V. Estimation of repaglinide and metformin HCl from pharmaceutical formulation by q-absorbance ratio method using UV spectrophotometer. International journal of pharma and bio sciences. 2024; 15(1):64-72.
CrossRef - Swetha Sri R.,Sowmya G., Bhavyasri K., mogili sumakanth. Review on derivative UV spectroscopy. International research journal of pharmacy. 2022; 13(2):1-3.
CrossRef - Govinda Verma andManish Mishra. Development and optimization of uv-vis spectroscopy – a review. World Journal of Pharmaceutical Research. 2018; 7(11): 1170-1180.
- Arun Sharma, Erum Gull Naz, Surabhi Singh, Kriti Tripathi.Fundamental concepts of spectroscopy and spectrometry analysis for chemical analysis. Kota (Raj.): Published by Career Point Ltd; 2016.
- Dipali M Atole, Hrishikesh H Rajput. Ultraviolet spectroscopy and its pharmaceutical applications- a brief review. Asian J Pharm Clin Res. 2018; 11(2): 2018, 59-66.
CrossRef - Sultan, Mohamed; Stecher, Gunther, etl.Sample Pretreatment and Determination of Non-Steroidal Anti-Inflammatory Drugs (NSAIDs) in Pharmaceutical Formulations and Biological Samples (Blood, Plasma, Erythrocytes) by HPLC-UV-MS and μ-HPLC. Current medicinal chemistry. 2005; 12(5): 573-588.
CrossRef - Rajni Dubey, Ashish Kumar, Bhaskar Kumar Gupta. A review of UV-Visible spectroscopy: techniques and applications. International Journal of Novel Research and Development. 2024; 9(10): b412-b423.
- Li Di, Edward H. Kerns. Biological assay challenges from compound solubility: strategies for bioassay optimization. Drug Discovery Today. 2006; 11: 446-451.
CrossRef - Pani Kumar, Durga Anumolu, Sunitha Gurrala, Archana Gellaboina, Divya Gayathri Mangipudi, Sahithya Menkana, Rajesh Chakka. Spectrophotometric Quantification of Anti-inflammatory Drugs by Application of Chromogenic Reagents. Turkish journal of pharmaceutical sciences. 2019; 16(4):410–415.
CrossRef - Christopher Singleton. Recent Advances in Bioanalytical Sample Preparation for Lc–Ms Analysis. Bioanalysis. 2012; 4(9): 1123-1140.
CrossRef - Pallavi N. Somthane, Irshad A. Shaikh, Nandkishor B. Bavage, Vidyasagar Gali, Shyamlila B. Bavage. Bioanalytical Method Validation and Its Pharmaceutical Application- A Review. World Journal of Pharmaceutical Research. 2020; 9(5): 2605-2622.
- Souverain S., Rudaz S.,Veuthey J.-L. Protein precipitation for the analysis of a drug cocktail in plasma by LC–ESI–MS. Journal of Pharmaceutical and Biomedical Analysis. 2004; 35(4): 913-920.
CrossRef - Cara Polson, Pratibha Sarkar, Bev Incledon, Vanaja Raguvaran, Russell Grant. Optimization of protein precipitation based upon effectiveness of protein removal and ionization effect in liquid chromatography–tandem mass spectrometry. Journal of Chromatography B. 2003; 785(2): 263-275.
CrossRef - Priscila Akemi Yamamoto, Jhohann Richard de Lima Benzi, Natália Valadares de Moraes. Simple and rapid HPLC-UV methods for gabapentin quantification in human plasma and urine: applicability in pharmacokinetics and drug monitoring. Journal of Basic and Applied Pharmaceutical Sciences. 2021; 42: 1-11.
CrossRef - Bhavyasri K. Method development, validation, and stress studies of dapagliflozin and metformin hydrochloride using ultraviolet-visible spectroscopy in bulk and combined pharmaceutical formulations. Bioscience biotechnology research communications. 2020; 13(4):1986-1992.
CrossRef - Shahlaei, Mohsen; Andisheh, Hadi; Derakhshandeh, Katayoun; Sadrjavadi, Komail; Azami, Mahsa. A novel method for simultaneous determination of codeine and acetaminophen in plasma by a combination of UV-vis spectroscopy and artificial neural network. Journal of Reports in Pharmaceutical Sciences. 2014; 3(2): 141-158.
CrossRef - Khagga bhavyasri, cheiati mounika, Sumakanth M. Method development, validation, and forced degradation studies for determination of tigecycline in bulk and pharmaceutical dosage form using UV spectroscopy. Journal of Young Pharmacists. 2020; 12(2s): s63-s66.
CrossRef - Bhavyasri khagga, kavya. Parelli, Sumakanth. Mogili. Development and validation of UV method for identification and qualification of betamethasone in API and drug formulation including stability studies. Journal of pharmaceutical sciences & research. 2021; 13(8): 452-456.
- Bhavyasri K., Sai Chandana R., Sumakanth M., Swetha Sri R.. Analytical method development and validation for the estimation of pioglitazone hydrochloride in bulk and formulation by UV spectrophotometry. American Journal of Pharm Tech Research. 2019; 9(4): 2249-3387.
CrossRef - Bhavyasri K., Dhanalakshmi Ch., Sumakanth M. Development and Validation of Ultra Violet-Visible Spectrophotometric Method for Estimation of Rivaroxaban in Spiked Human Plasma. Journal of Pharmaceutical sciences and research. 2020; 1(9): 1215-1219.
- Bhavyasri K and Manisha M. UV-spectrophotometric estimation and forced degradation studies of tenofovir alafenamide fumarate (TAF) in its bulk and tablet dosage form. Research journal of pharmacy and technology. 2020; 13(3): 1231-1235.
CrossRef - Bhavyasri K., Anila B., Saileela S., Mogili Sumakanth. Method development of niacin in bulk and dosage form by UV visible spectrophotometer. International journal of modern pharmaceutical research. 2022; 6(9), 41-43.
- Li Di, Edward H. Kerns. Biological assay challenges from compound solubility: strategies for bioassay optimization. Drug Discovery Today. 2006; 11: 446-451.
CrossRef - Pani Kumar, Durga Anumolu, Sunitha Gurrala, Archana Gellaboina, Divya Gayathri Mangipudi, Sahithya Menkana, Rajesh Chakka. Spectrophotometric Quantification of Anti-inflammatory Drugs by Application of Chromogenic Reagents. Turkish journal of pharmaceutical sciences. 2019; 16(4):410–415.
CrossRef - International Council for Harmonization of Technical Requirements for Pharmaceuticals for Human Use, Bioanalytical Method Validation and Study Sample Analysis (M10), Final version Adopted on 24 May 2022.
- Rama Rao Kalakuntla and Santosh Kumar K. Bioanalytical Method Validation: A Quality Assurance Auditor View Point. Journal of Pharmaceutical Sciences and Research. 2009. 1(3): 1-10.
- Blanchet B.,Billemont, CramardJ.,BenichouA.S. , Chhun,S., etl.Validation of an HPLC-UV method for sorafenib determination in human plasma and application to cancer patients in routine clinical practice. Journal of Pharmaceutical and Biomedical Analysis. 2009; 49(4): 1109-1114.
CrossRef - Rohit S.Soman, Hamim Zahir, Fatemeh Development and validation of an HPLC-UV method for determination of iohexol in human plasma. Journal of Chromatography B. 2005; 816(1-2): 339-343.
CrossRef - Aline T. Marinho, Ana L. A. Godinho, David A. Novais, Alexander M. M. Antunes, M. Matilde Marques, Teresa Ramos, Clara G. Dias, Emilica C. Monteior and Sofia A. Pereira. Development and Validation of an RP-HPLC method for quantifying nevirapine and its main phase I metabolites in human blood. Analytical methods. 2014; 6: 1575-1580.
CrossRef - Escudero-Ortiz, Vanesa, Perez-Ruixo, Juan J., Valenzuela, Belen. Development and Validation of an HPLC-UV Method for Pazopanib Quantification in Human Plasma and Application to Patients with Cancer in Routine Clinical Practice. Therapeutic Drug Monitoring. 2015; 37(2): 172-179.
CrossRef - Emrah Dural, Gorkem Mergen, Tulin Soylemezoglu. Optimization and Validation of an HPLC-UV Method for Analysis of Clozapine and Its Major Metabolites in Human Plasma. Turk J Pharm Sci. 2015; 12(2): 177-186.
CrossRef - Hammam A. Mowafy, Fars K. Alanazi, Gamal M. El Maghraby. Development and validation of an HPLC–UV method for the quantification of carbamazepine in rabbit plasma. Saudi Pharmaceutical Journal. 2012; 20(1): 29-34.
CrossRef
Abbreviations
Dabigatran etexilate mesylate (DAB), Ultra violet visible (UV) spectroscopy, Reverse phase high performance liquid chromatography (RP-HPLC), High performance liquid chromatography (HPLC), Hydrochloric acid (HCl), standard deviation relative (RSD), Quality control (QC), Limit of Quantification (LOQ), Limit of Detection (LOD).

This work is licensed under a Creative Commons Attribution 4.0 International License.


